

Companies say they have loyal customers. Few can prove it. A rising retention rate looks like customer loyalty on a dashboard, but it can just as easily mean your customers haven't found a better option, or that leaving would cost them too much hassle.
Learning how to measure customer loyalty means telling those situations apart. You need to know whether people come back, whether they'd choose you again if the decision were wide open, and whether the customers who stay are worth more over time. Each question needs its own metric, and no single score answers all three.
Customer Loyalty
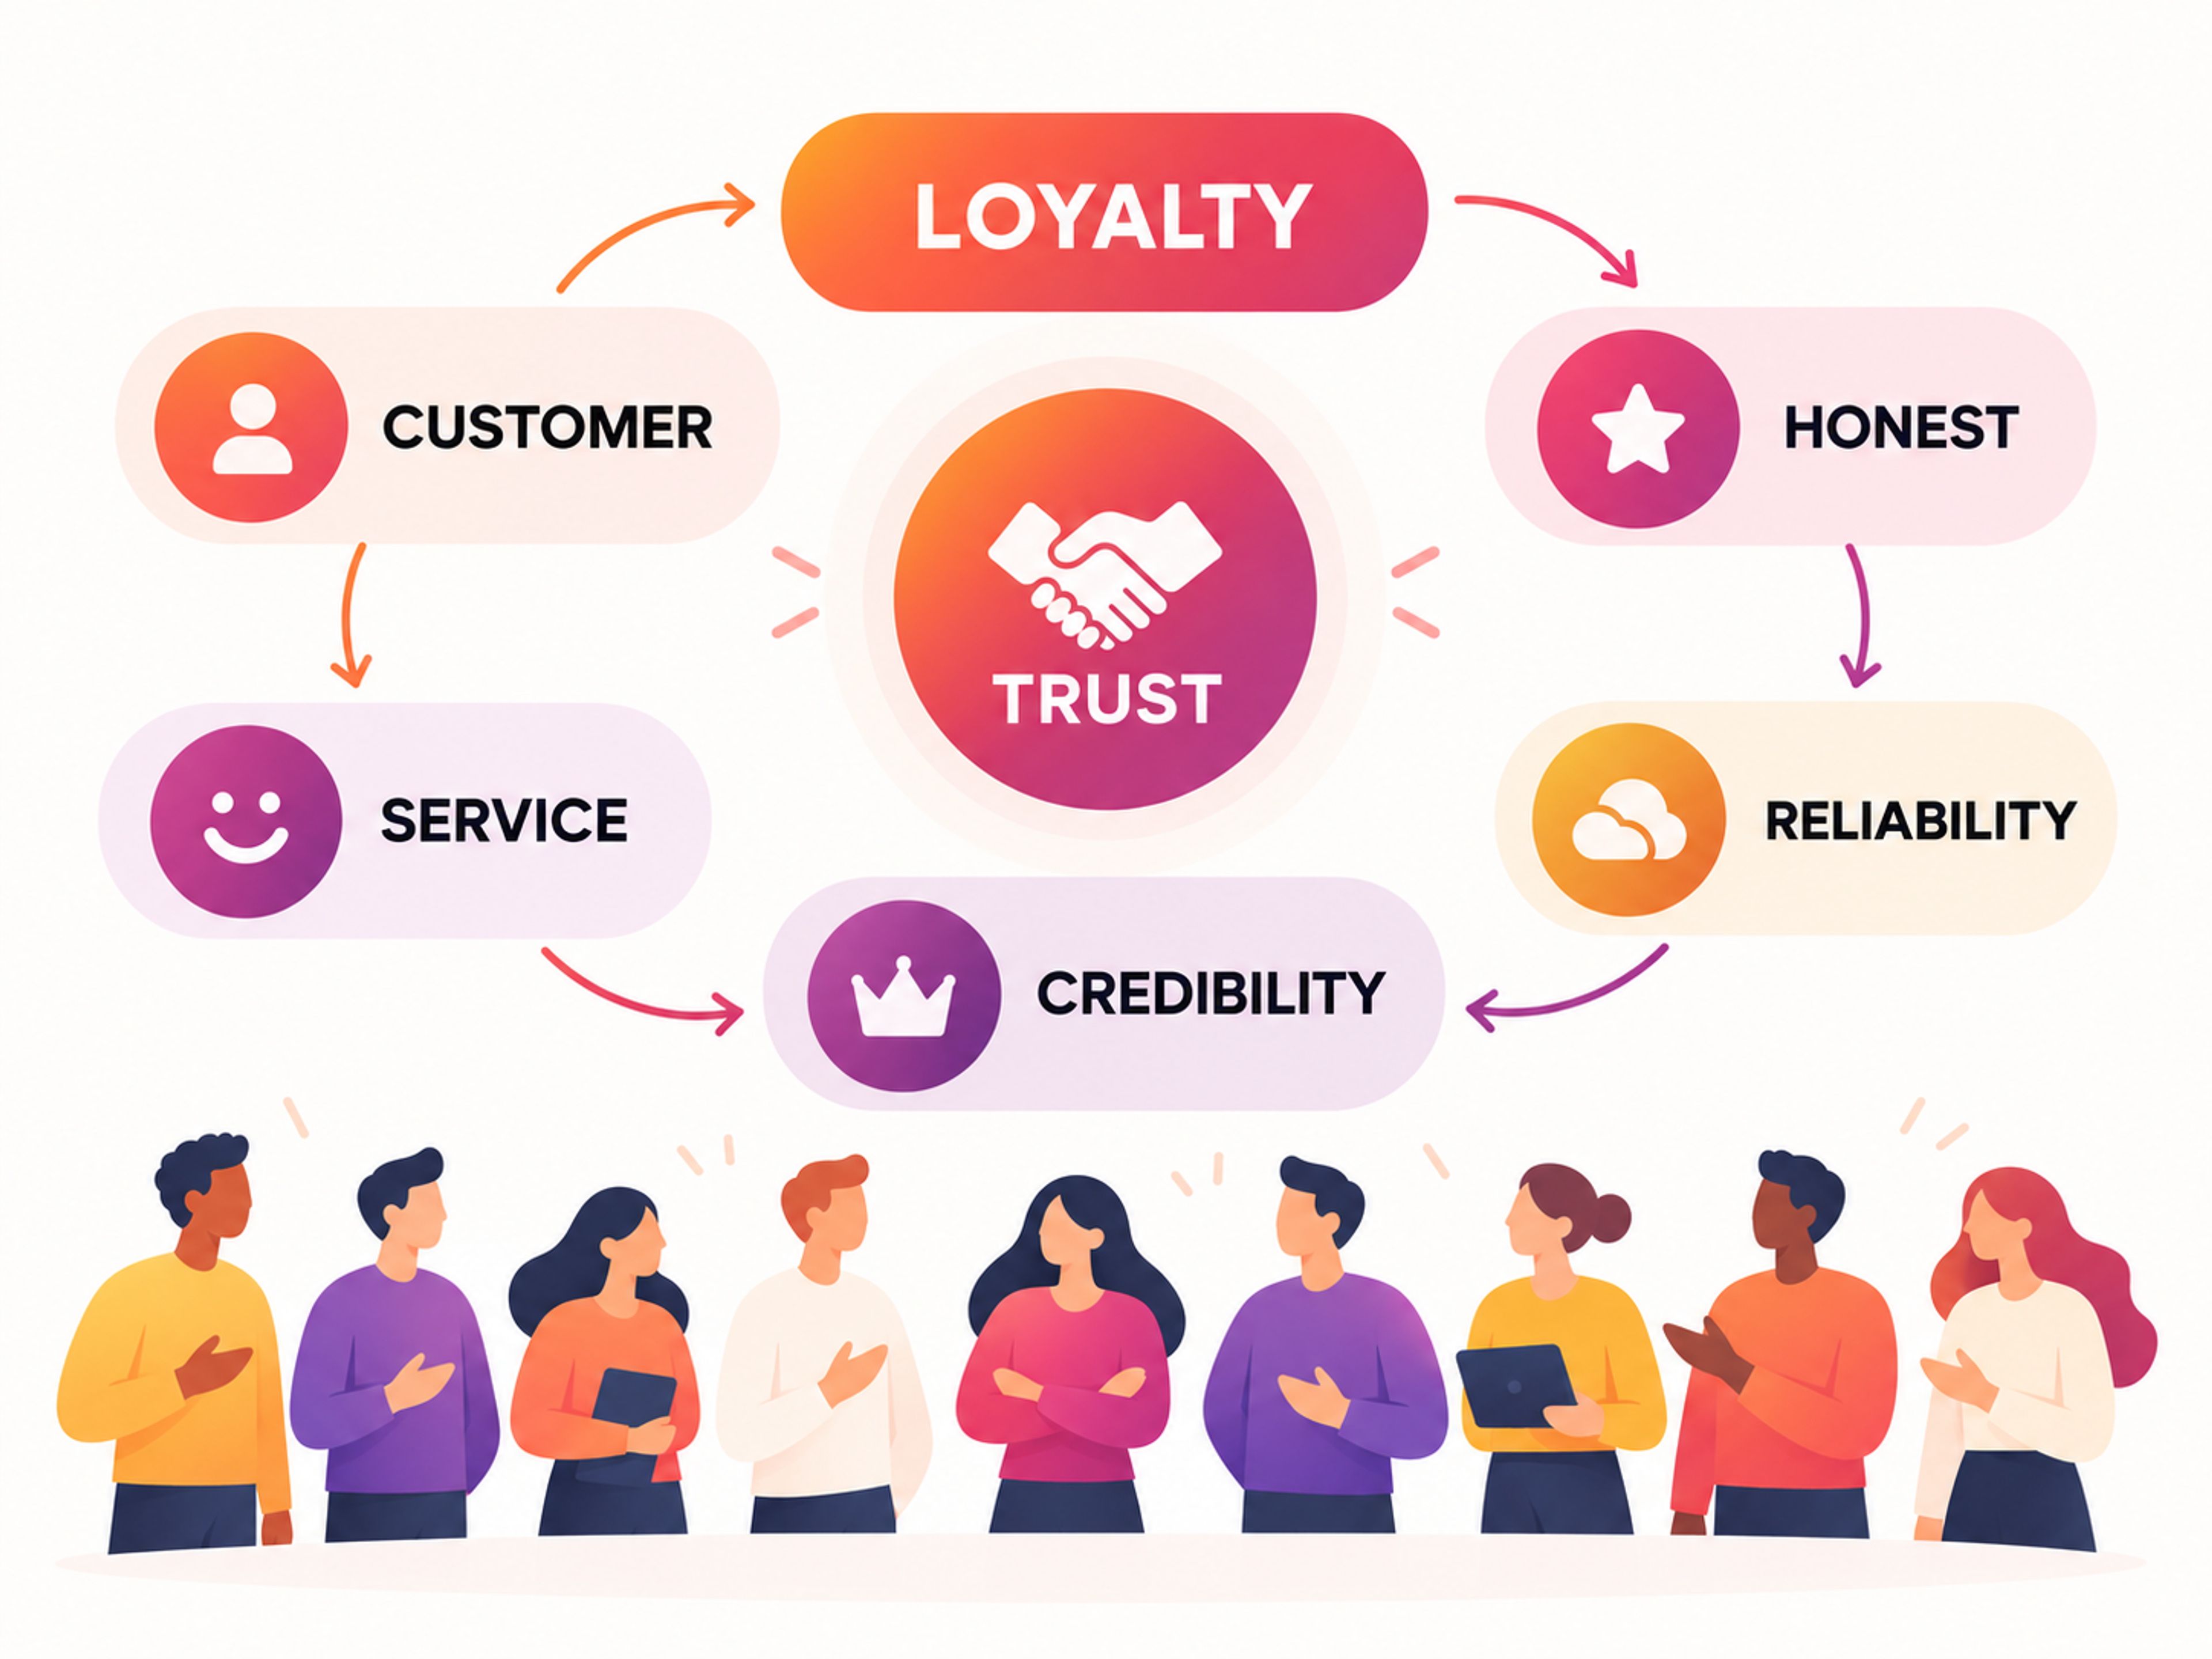
The stakes are practical. Misread loyalty, and your retention budget flows to customers who were never going to leave, or to customers who cost more to serve than they bring in.
Key Takeaways
- Customer loyalty has three layers you can measure separately. Behavior shows whether customers return, attitude shows whether they'd choose you again, and value shows whether they're worth more over time.
- Track at least one metric per layer. Retention or repeat purchase rate covers behavior, NPS or CES covers attitude, and CLV covers value.
- High retention without positive sentiment often signals inertia or switching costs, and both disappear the moment a competitor removes them.
- NPS works best as one input among several, since it doesn't reliably outperform satisfaction measures at predicting growth.
- Your business model decides your primary metric. Repeat purchase rate means little for a mattress brand and a lot for a coffee subscription.
- Customer effort is a design problem. Friction in onboarding, checkout, and support shows up later as churn.
What Customer Loyalty Means (and What It Doesn't)
Customer loyalty is a customer's tendency to keep choosing your company when they have other options. Two things have to be true at once:
1.
The customer keeps buying, which is behavioral loyalty2.
The customer prefers you over the alternatives, which is attitudinal loyalty
When only the first is true, you're looking at spurious loyalty. Picture a bank customer who hasn't switched because moving direct deposits is a chore, or a software team stuck on a tool because migration would eat a quarter. Their retention looks healthy. Their loyalty is fragile, and a competitor that removes the switching cost can take them overnight.
The reverse happens too. Latent loyalty describes customers who love your brand but buy rarely, held back by price, distance, or a long purchase cycle. A furniture brand can have devoted fans who buy once every seven years, and purchase data alone would label them lapsed.
How to Build Customer Loyalty
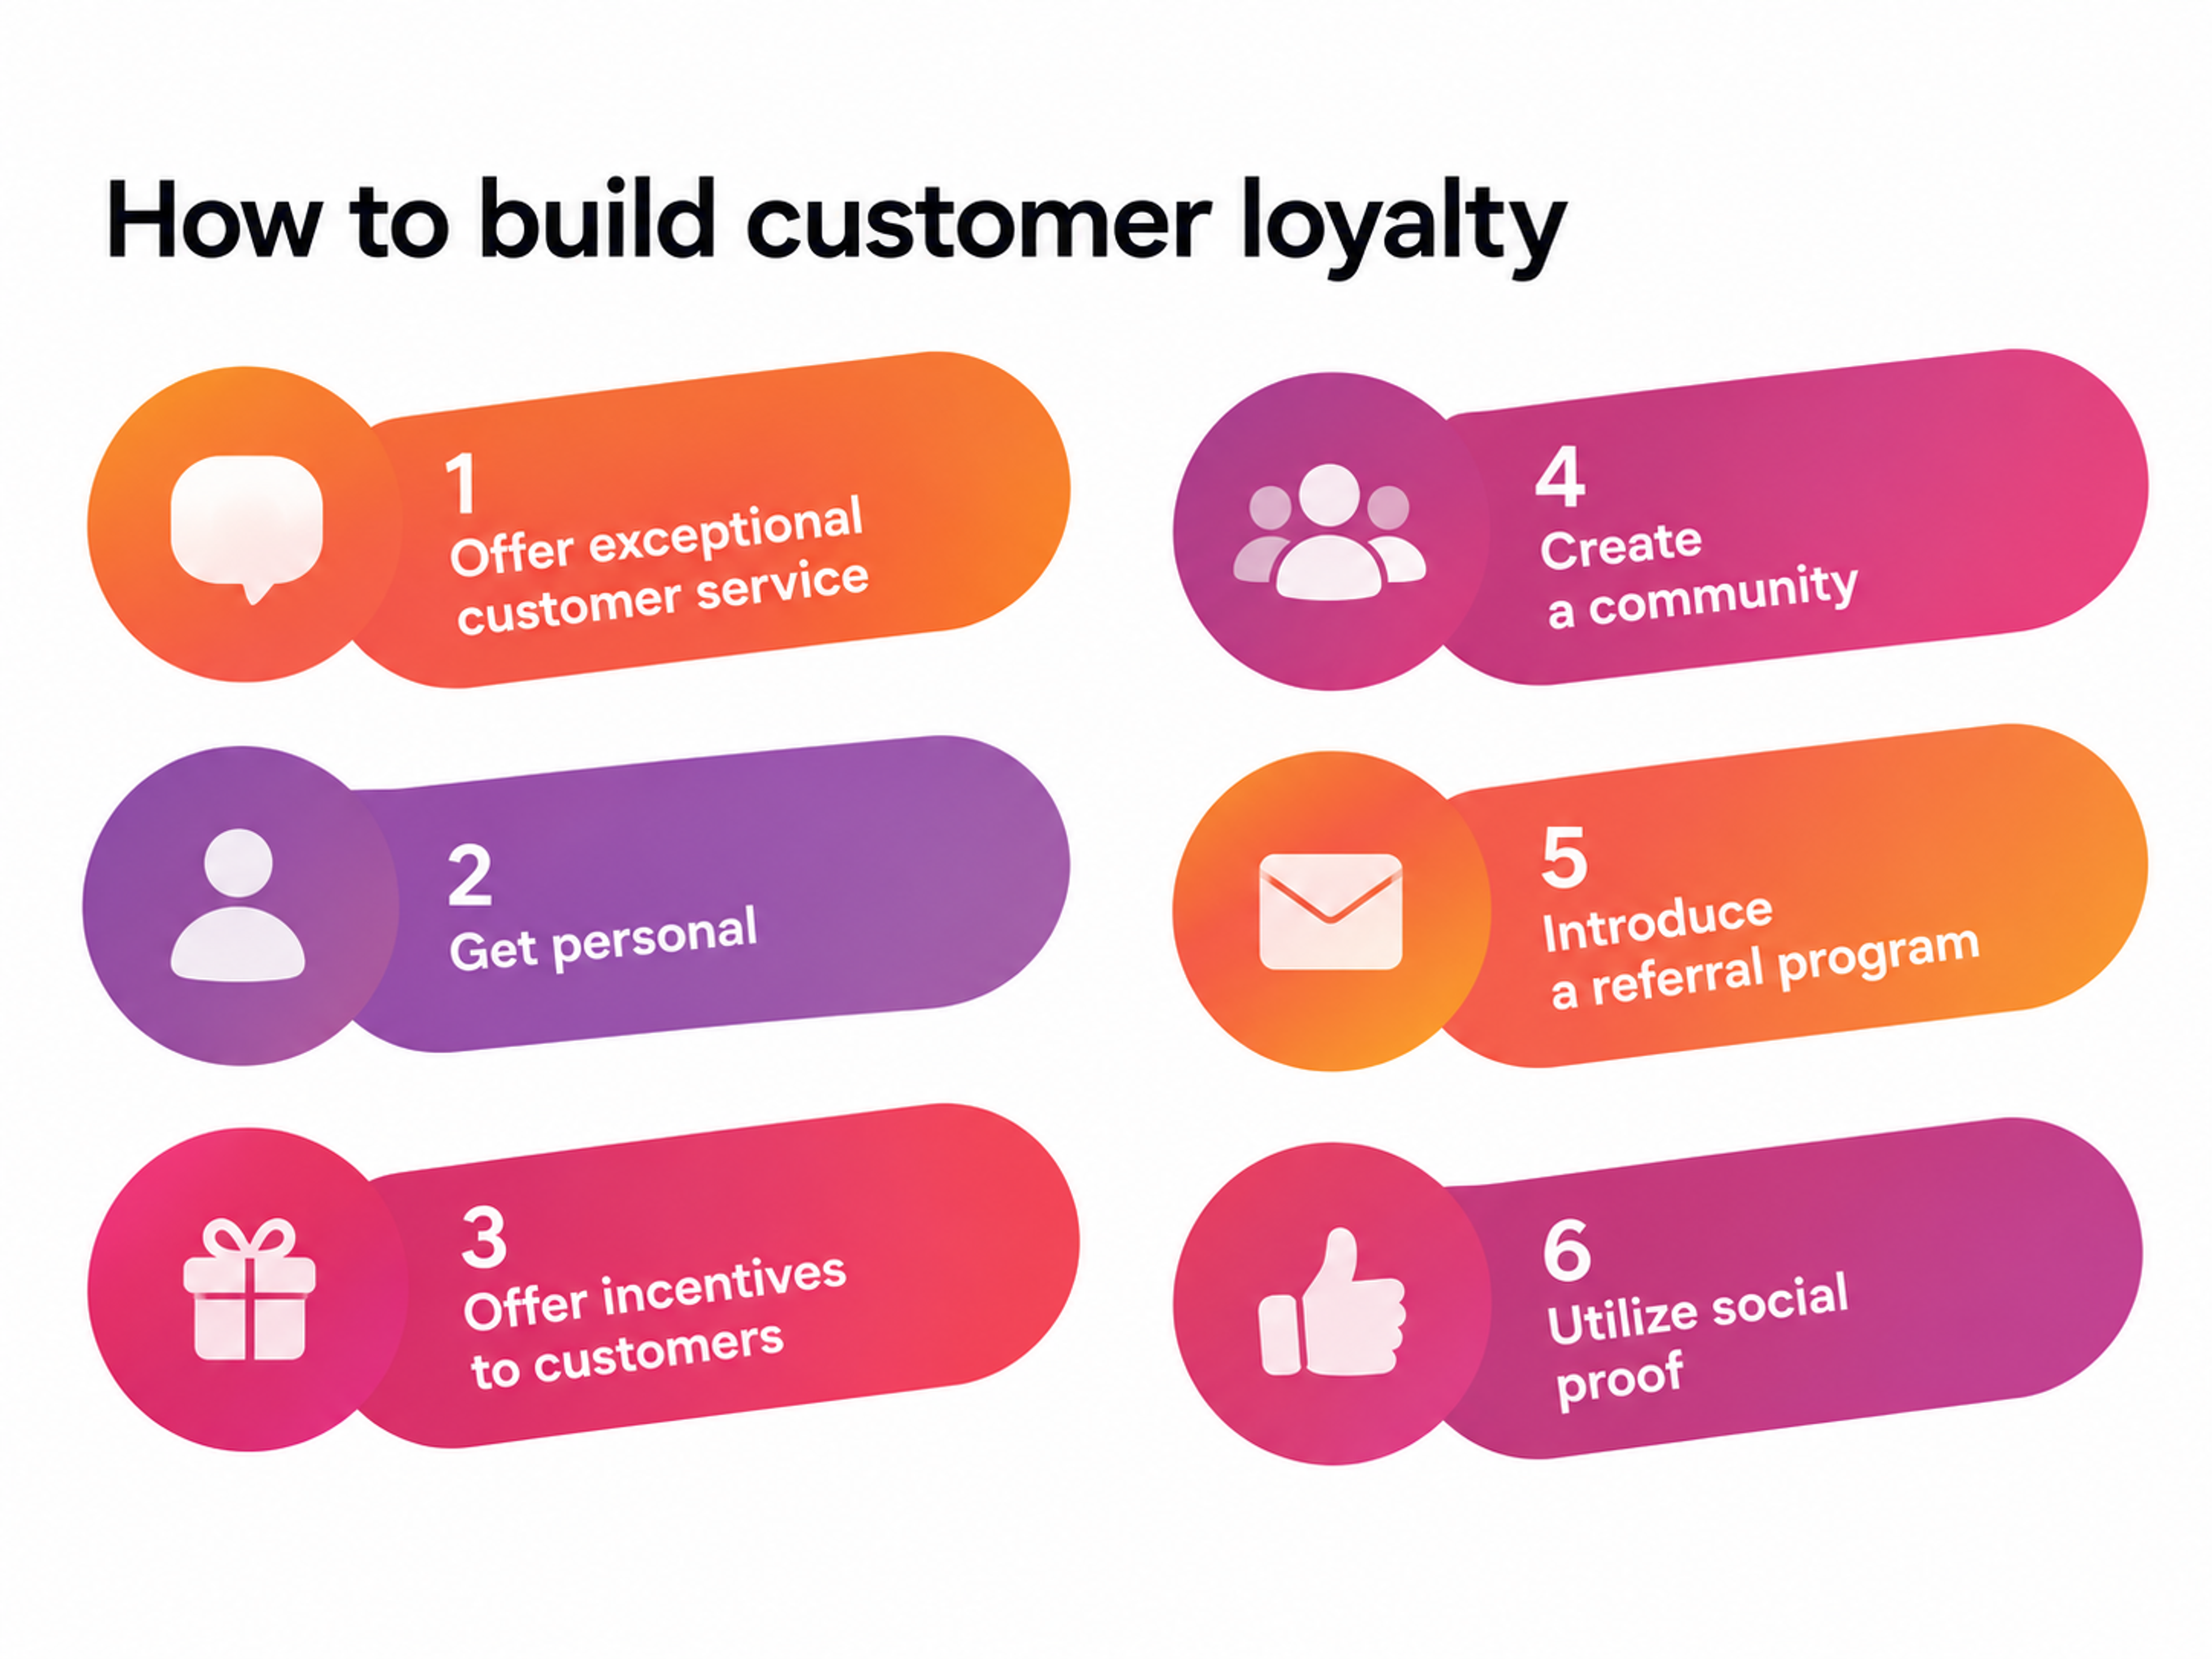
Satisfaction sits underneath both. A satisfied customer had a good experience. A loyal customer has a reason to return and stay when a cheaper option appears.
Measuring loyalty matters because loyal customers aren't equally valuable, and the gaps between them are wide. Revenue tends to follow the 80/20 rule.
Profit is far more skewed, and the least profitable 20% of customers can wipe out 50% to 200% of total profits. Track loyalty without tracking value, and you may end up rewarding the customers who cost you money.
Customer Loyalty vs Brand Loyalty vs Customer Retention
These three terms get used interchangeably. Each one answers a different question and calls for a different measurement.
- Customer retention is an outcome. It counts how many customers are still active at the end of a period, regardless of why they stayed, and you measure it from transaction or subscription data.
- Customer loyalty is a relationship with a specific company, built from accumulated experience with the product, service, pricing, and support. You measure it with a mix of behavioral data and customer feedback.
- Brand loyalty is attachment to a brand's identity, values, and meaning, and it can exist before someone ever buys. A teenager can be loyal to a sneaker brand they can't afford yet. You measure it through brand tracking, stated preference, and willingness to pay a premium.
The overlap matters for diagnosis. Strong retention paired with weak loyalty scores is a switching-cost problem waiting to happen. High brand loyalty paired with low retention means the product or service experience isn't living up to the brand promise.
Customer Loyalty vs Brand Loyalty vs Customer Retention
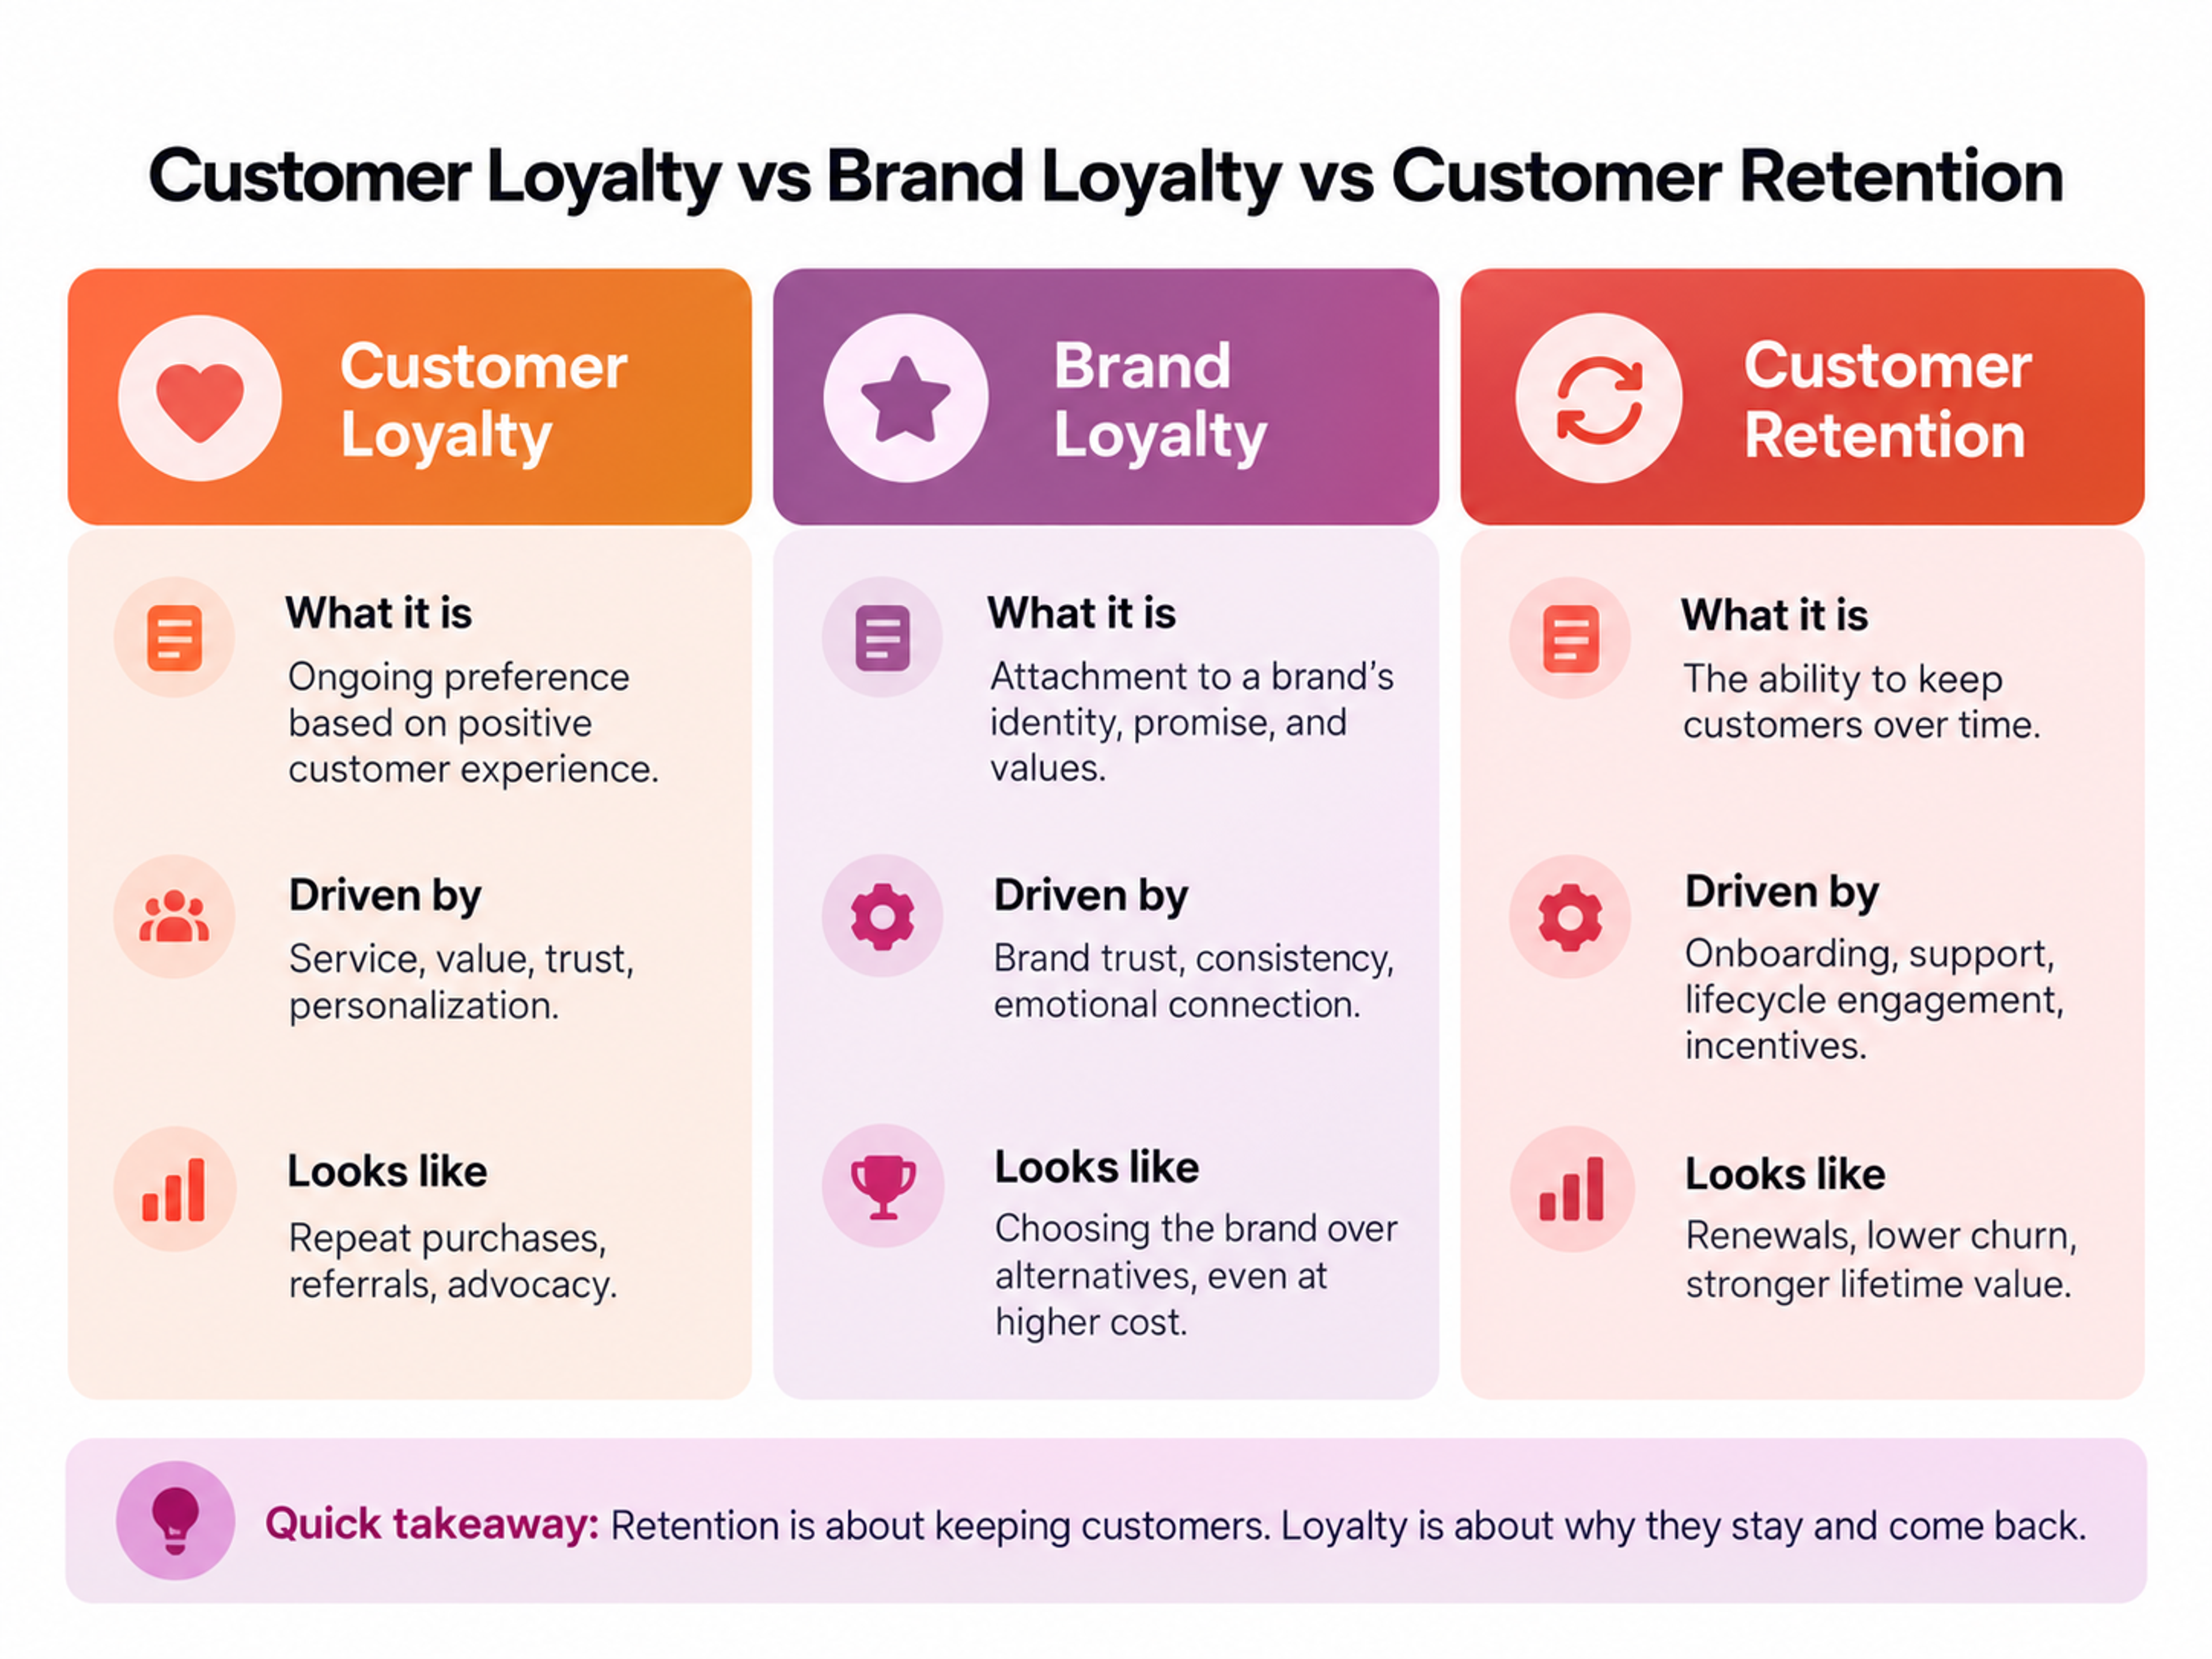
Weak numbers on all three point to a core product problem that no loyalty program will fix. A strong brand identity earns the first purchase. The experience decides whether there's a second.
Types of Customer Loyalty and the Signal Each One Leaves
Knowing which kind of loyalty your customers show tells you which metric to watch and how exposed your customer base is.
Transactional Loyalty
Customers come back for discounts, points, or cashback, and the relationship lasts as long as the incentive does. You'll spot it when redemption-heavy customers make up a large share of repeat purchases and purchase frequency drops after a promotion ends.
To test it, pause a promotion for one segment and see whether that segment's purchase frequency holds.
Behavioral Loyalty
Habit and convenience drive the repeat purchases. Think subscription renewals, the same grocery app every week, or the default payment method on a phone.
Repeat purchase rate looks strong here while attitudinal scores stay flat, and that gap is the early warning sign of spurious loyalty.
4 Types of Customer Loyalty
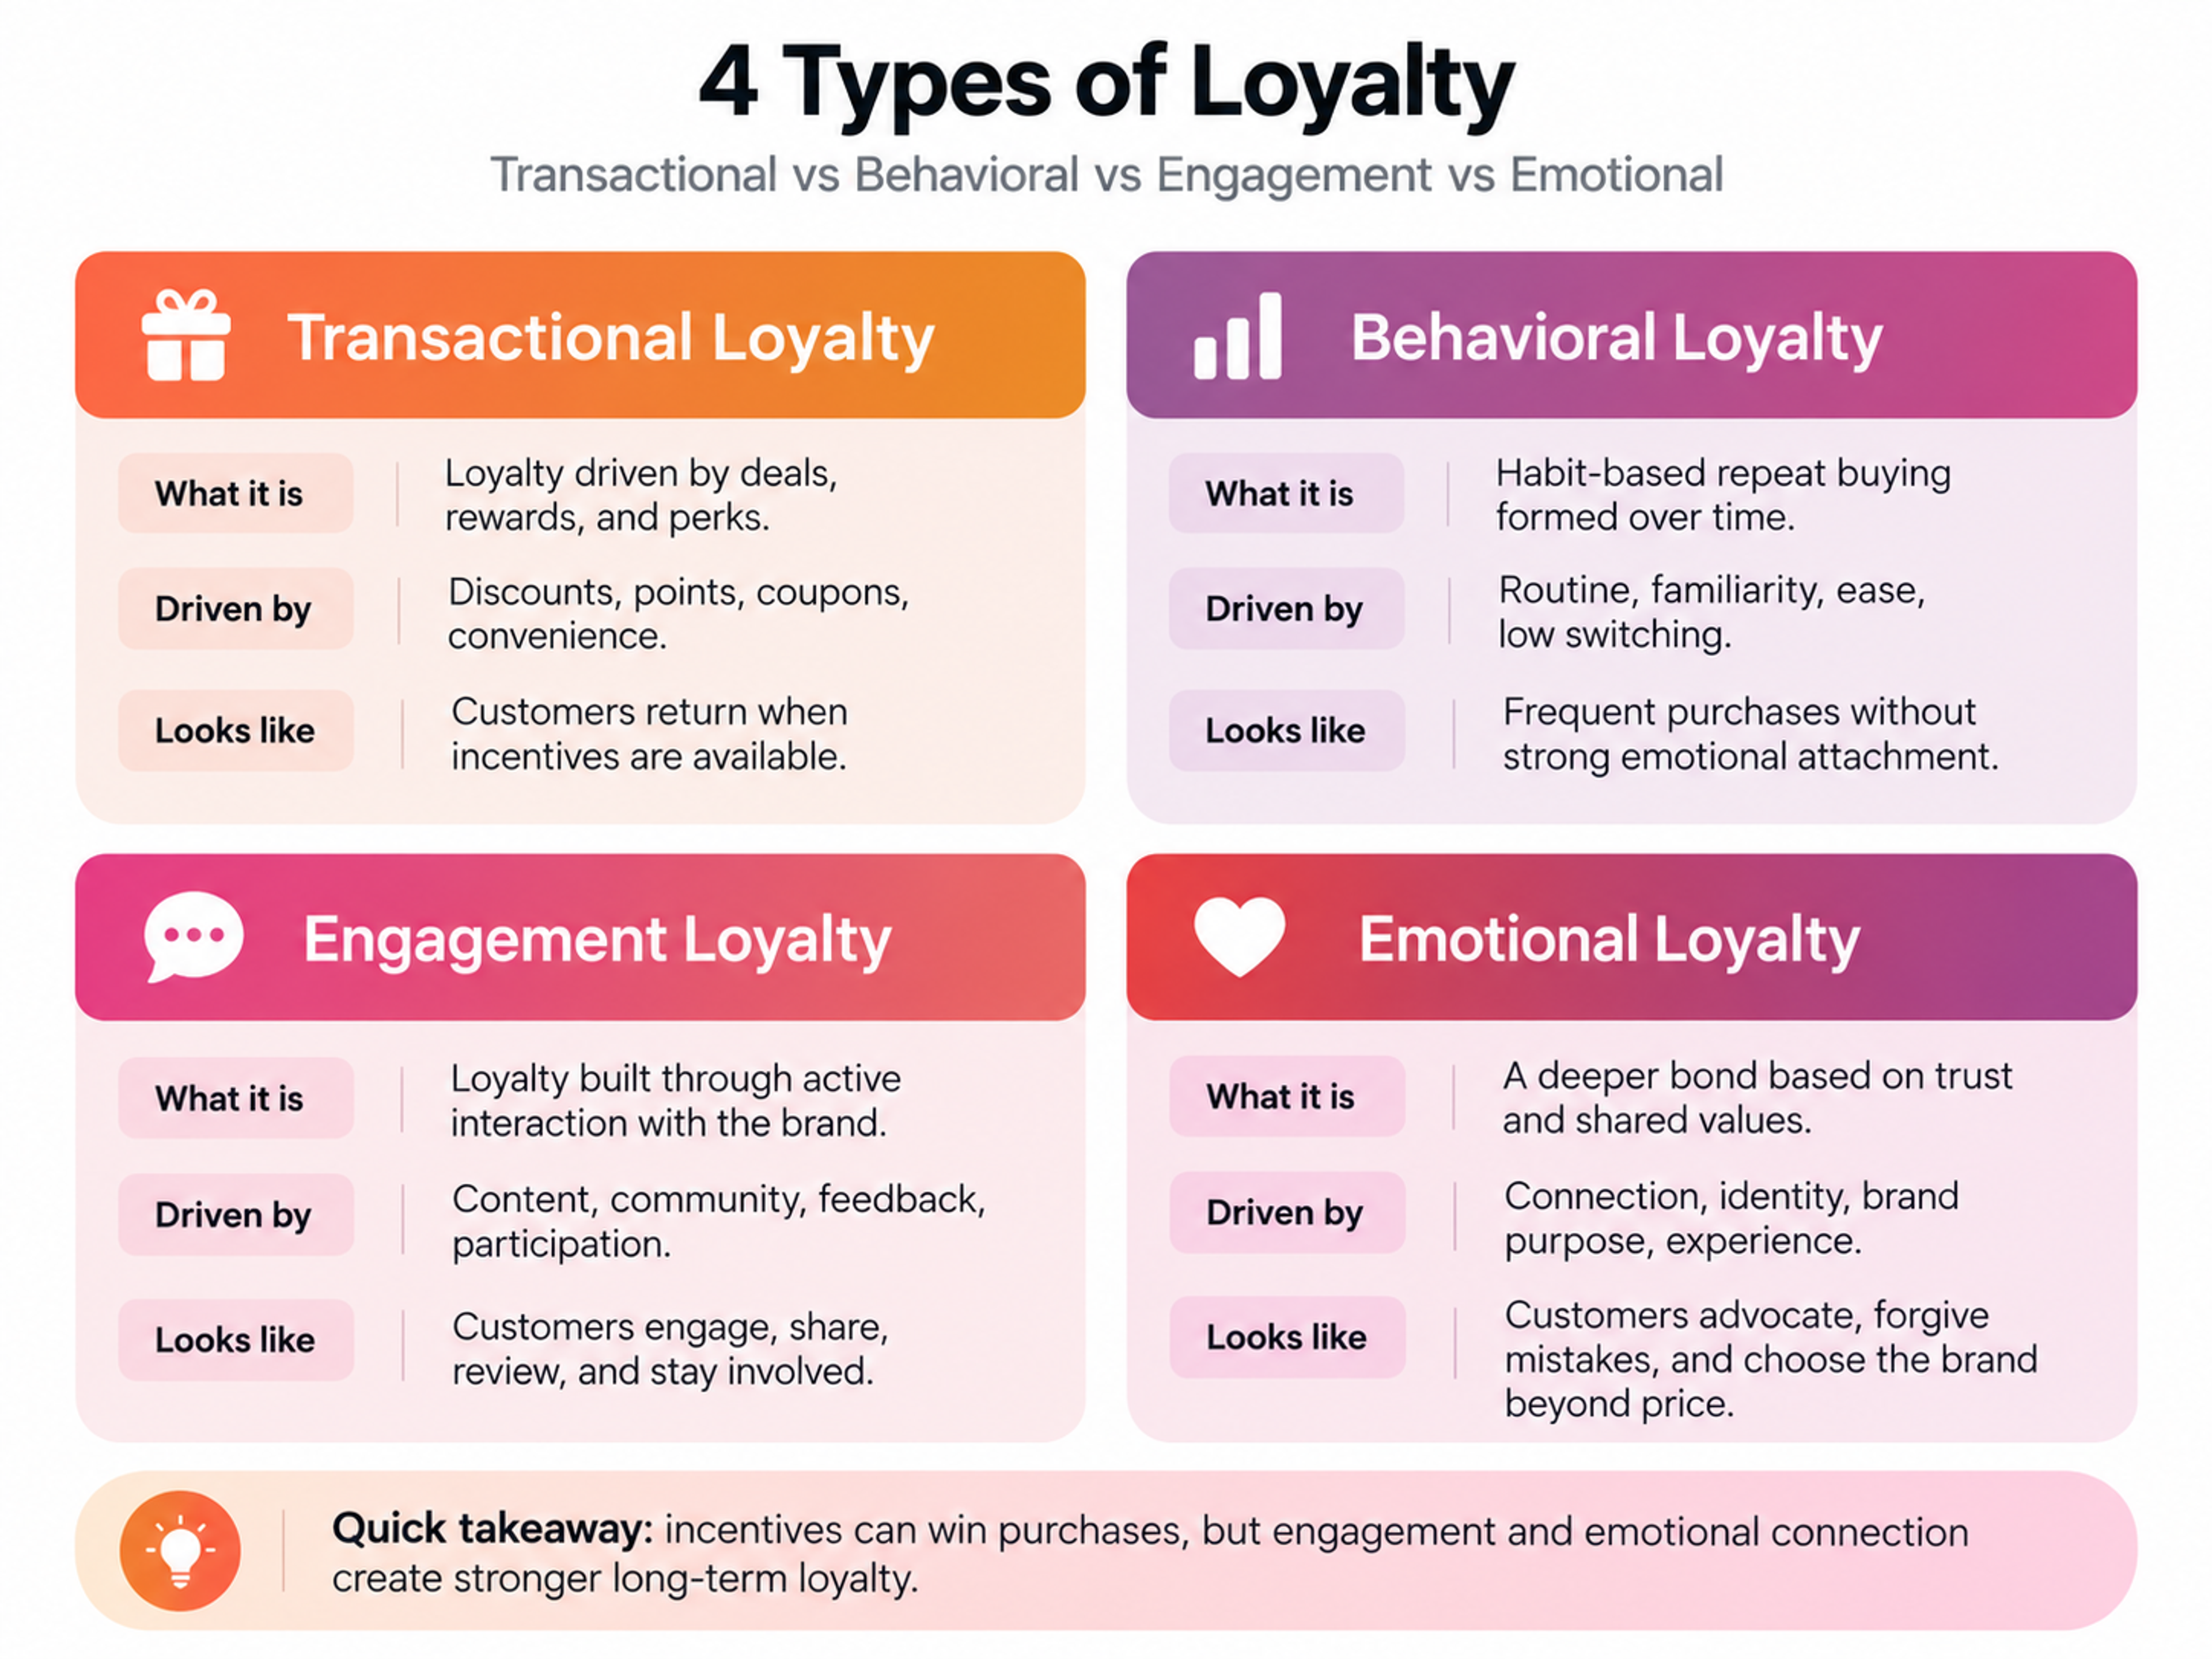
Engagement Loyalty
These customers interact with the brand beyond buying. They open the app between purchases, join communities, respond to content, and follow you on social media.
Active usage, community participation, and content interaction catch this type of loyalty before it shows up in revenue. These customers also tend to be your earliest source of product feedback, so give them a direct line to your team.
Emotional Loyalty
Customers feel the brand reflects their values or identity, so they stay even when a competitor is cheaper. Promoter share in NPS, referral rate, and low price sensitivity are the signals to watch.
Bookshop.org shows the pattern well. Readers could buy the same books elsewhere with less effort, yet they choose a platform that shares its profit with local shops, with more than $50 million raised for independent bookstores. The product matches the competition. The reason to return is the mission.
How to Measure Customer Loyalty With the Right Metrics
Measure each layer of loyalty with at least one metric. The worked examples below follow a fictional coffee subscription brand that starts a quarter with 2,000 customers.
Behavioral Metrics
Customer retention rate (CRR) shows what share of existing customers stayed active through a period. The formula excludes new customers so growth can't mask losses.
CRR = ((customers at end − new customers) ÷ customers at start) × 100
The coffee brand ends the quarter with 2,100 customers after gaining 500 new ones. That gives ((2,100 − 500) ÷ 2,000) × 100 = 80%.
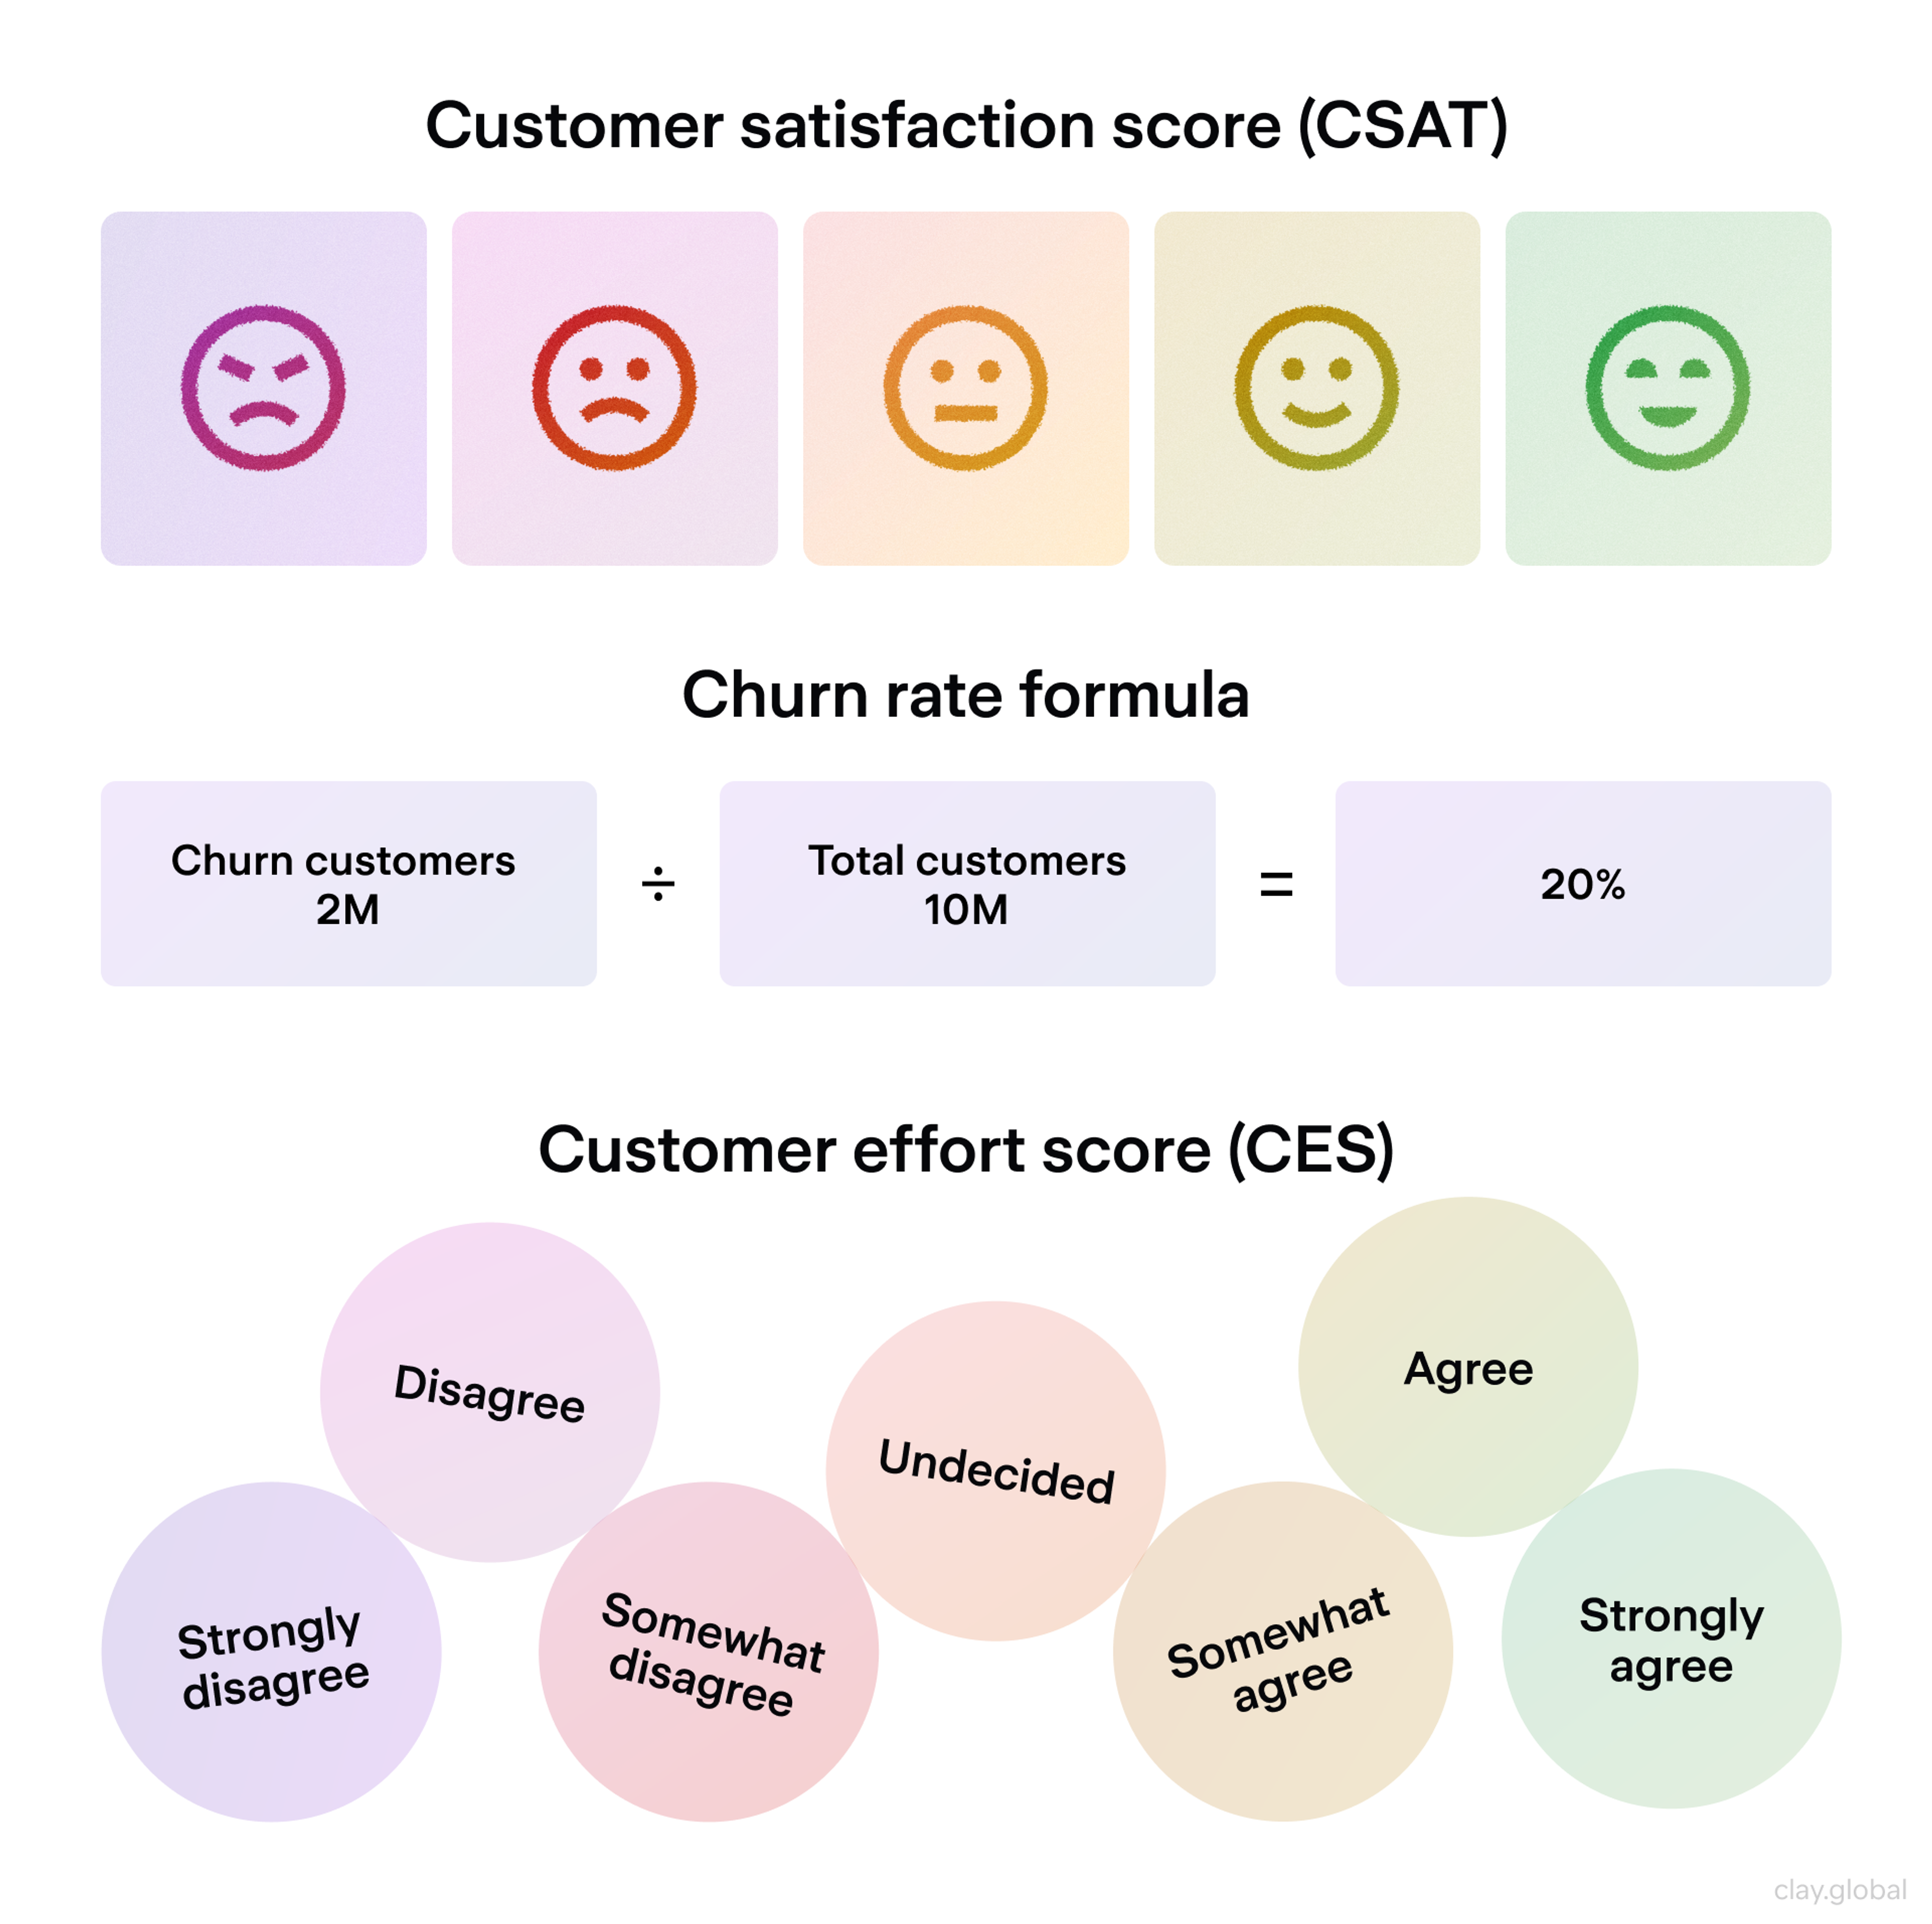
Churn rate is the mirror image. It's the share of starting customers you lost.
Churn rate = (customers lost ÷ customers at start) × 100
Churn Rate
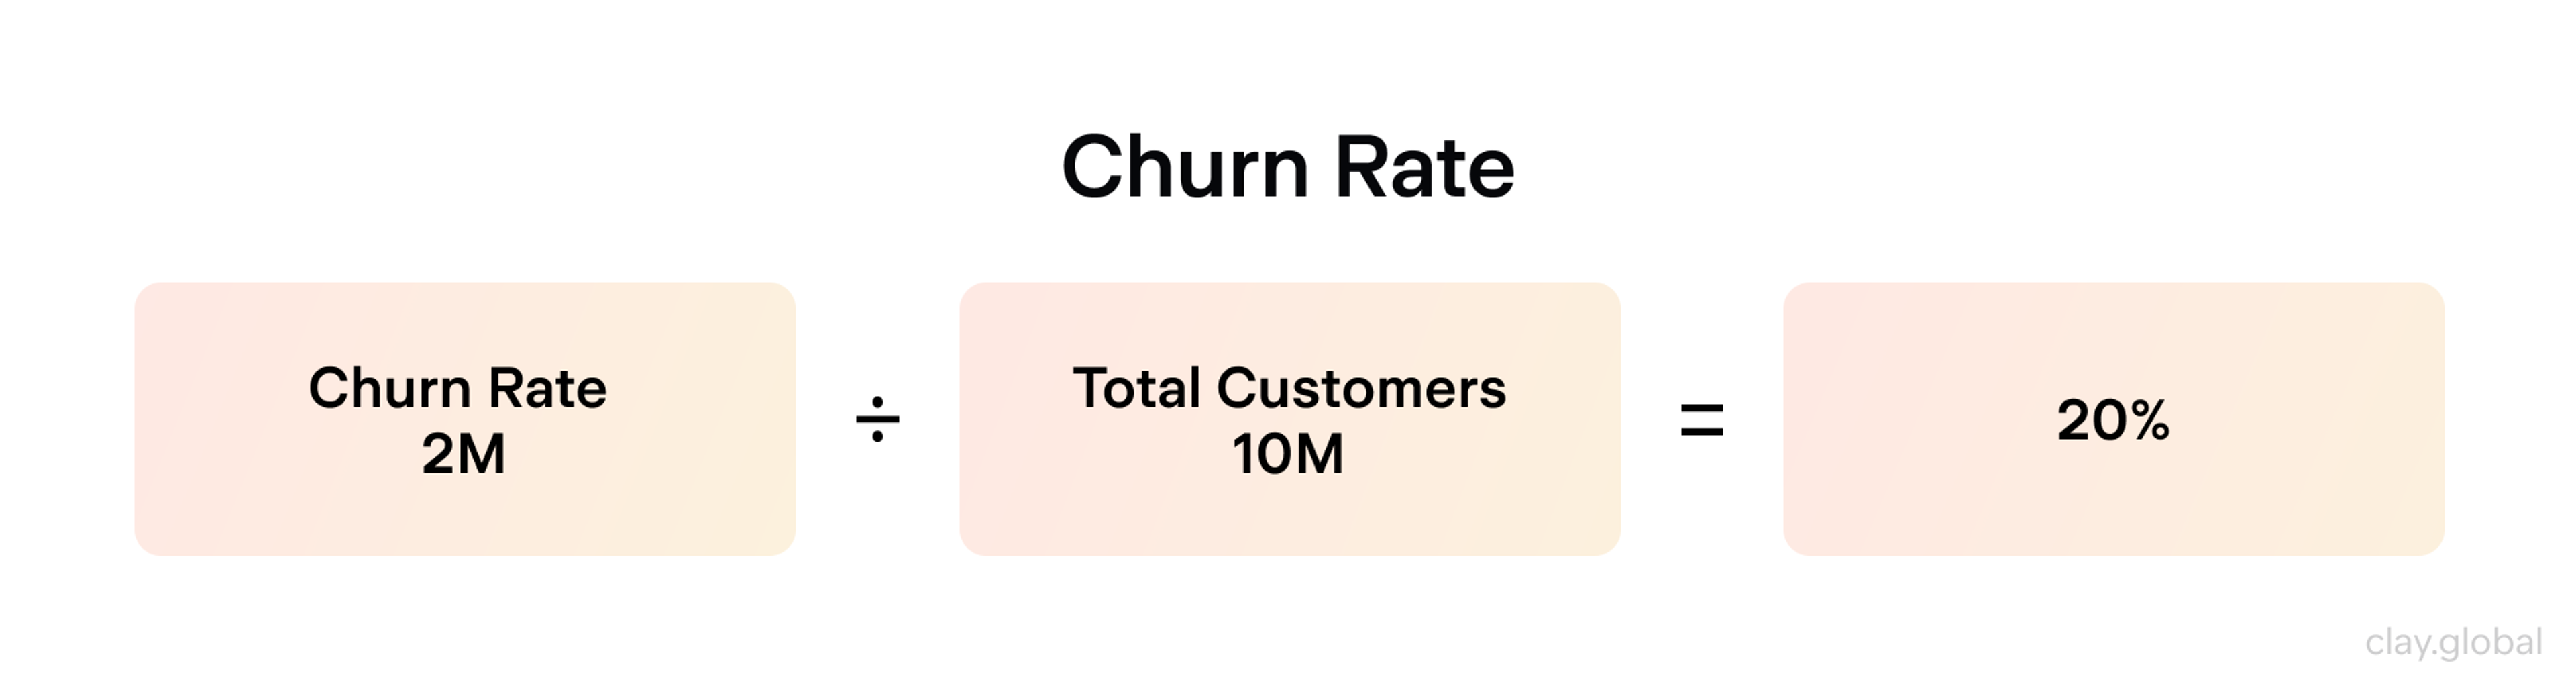
The brand lost 400 of its 2,000 starting customers, so churn is 20%. Subscription businesses should also track revenue churn, since losing one large account can hurt more than losing ten small ones.
Repeat purchase rate shows what share of customers bought more than once in a period.
Repeat purchase rate = (customers with two or more purchases ÷ total customers) × 100
If 630 of the brand's 2,100 customers ordered more than once this quarter, the rate is 30%. Pair it with purchase frequency (total orders divided by unique customers) and the average time between purchases to see whether customers are speeding up or drifting away.
Attitudinal Metrics
Net Promoter Score (NPS) asks how likely a customer is to recommend you on a scale of 0 to 10. Promoters answer 9 or 10, passives answer 7 or 8, and detractors answer 0 to 6. NPS equals the percentage of promoters minus the percentage of detractors, so it ranges from −100 to +100.
Customer satisfaction score (CSAT) measures satisfaction with a specific interaction, usually on a 1 to 5 scale. Most teams report it as the share of 4 and 5 responses.
CSAT
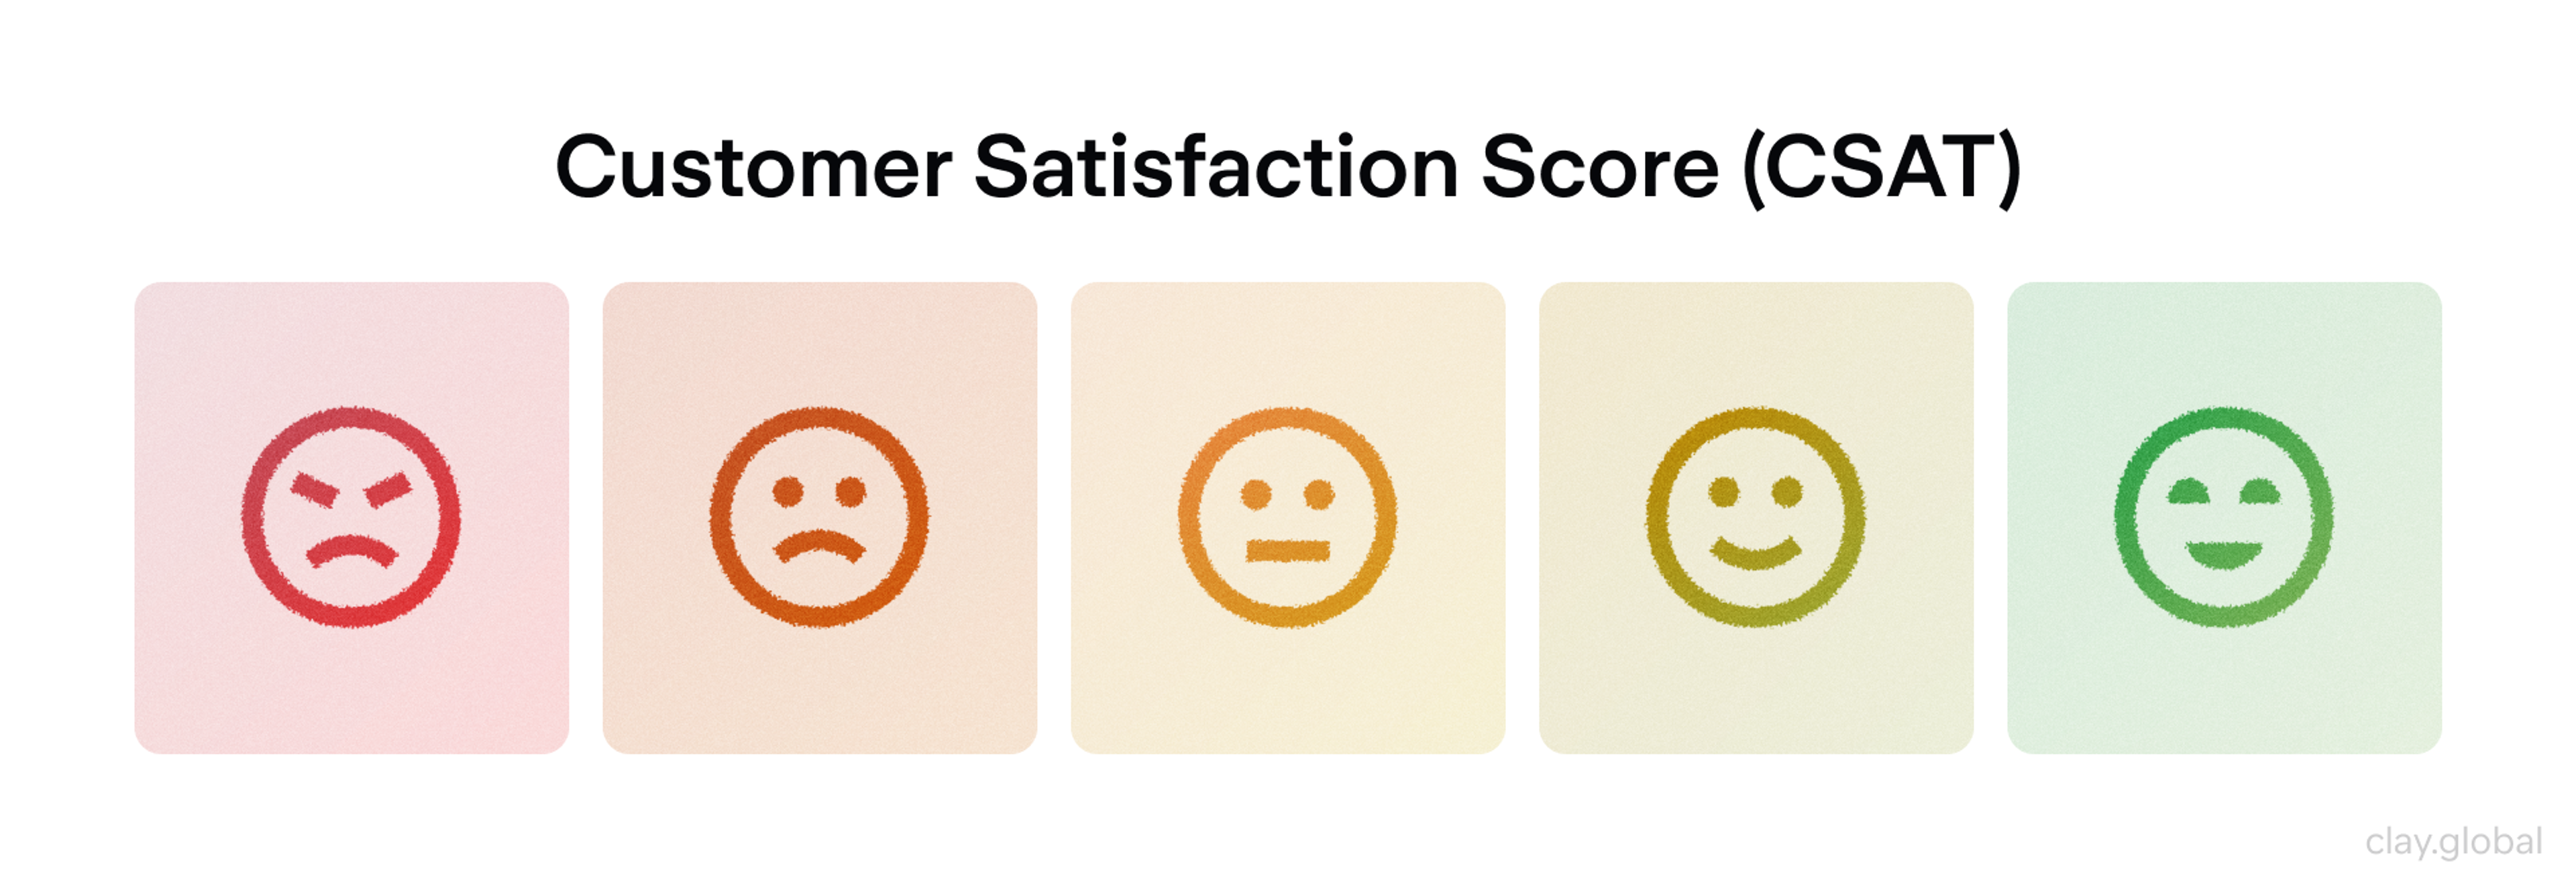
Customer effort score (CES) asks how easy it was to get something done, such as fixing a problem or placing an order, typically on a 1 to 7 scale. It zeroes in on friction, the part of an experience customers remember when they decide whether to come back.
Customer loyalty index (CLI) averages three 0 to 10 questions about likelihood to recommend, to buy again, and to try other products. It's steadier than NPS alone because it blends advocacy with repurchase intent.
Survey scores tell you something's off, and UX research tells you where. Work with Clay to turn feedback into a better experience.
Value Metrics
Customer lifetime value (CLV) estimates the revenue a customer generates over the whole relationship.
CLV = average order value × purchases per year × average customer lifespan in years
CLV
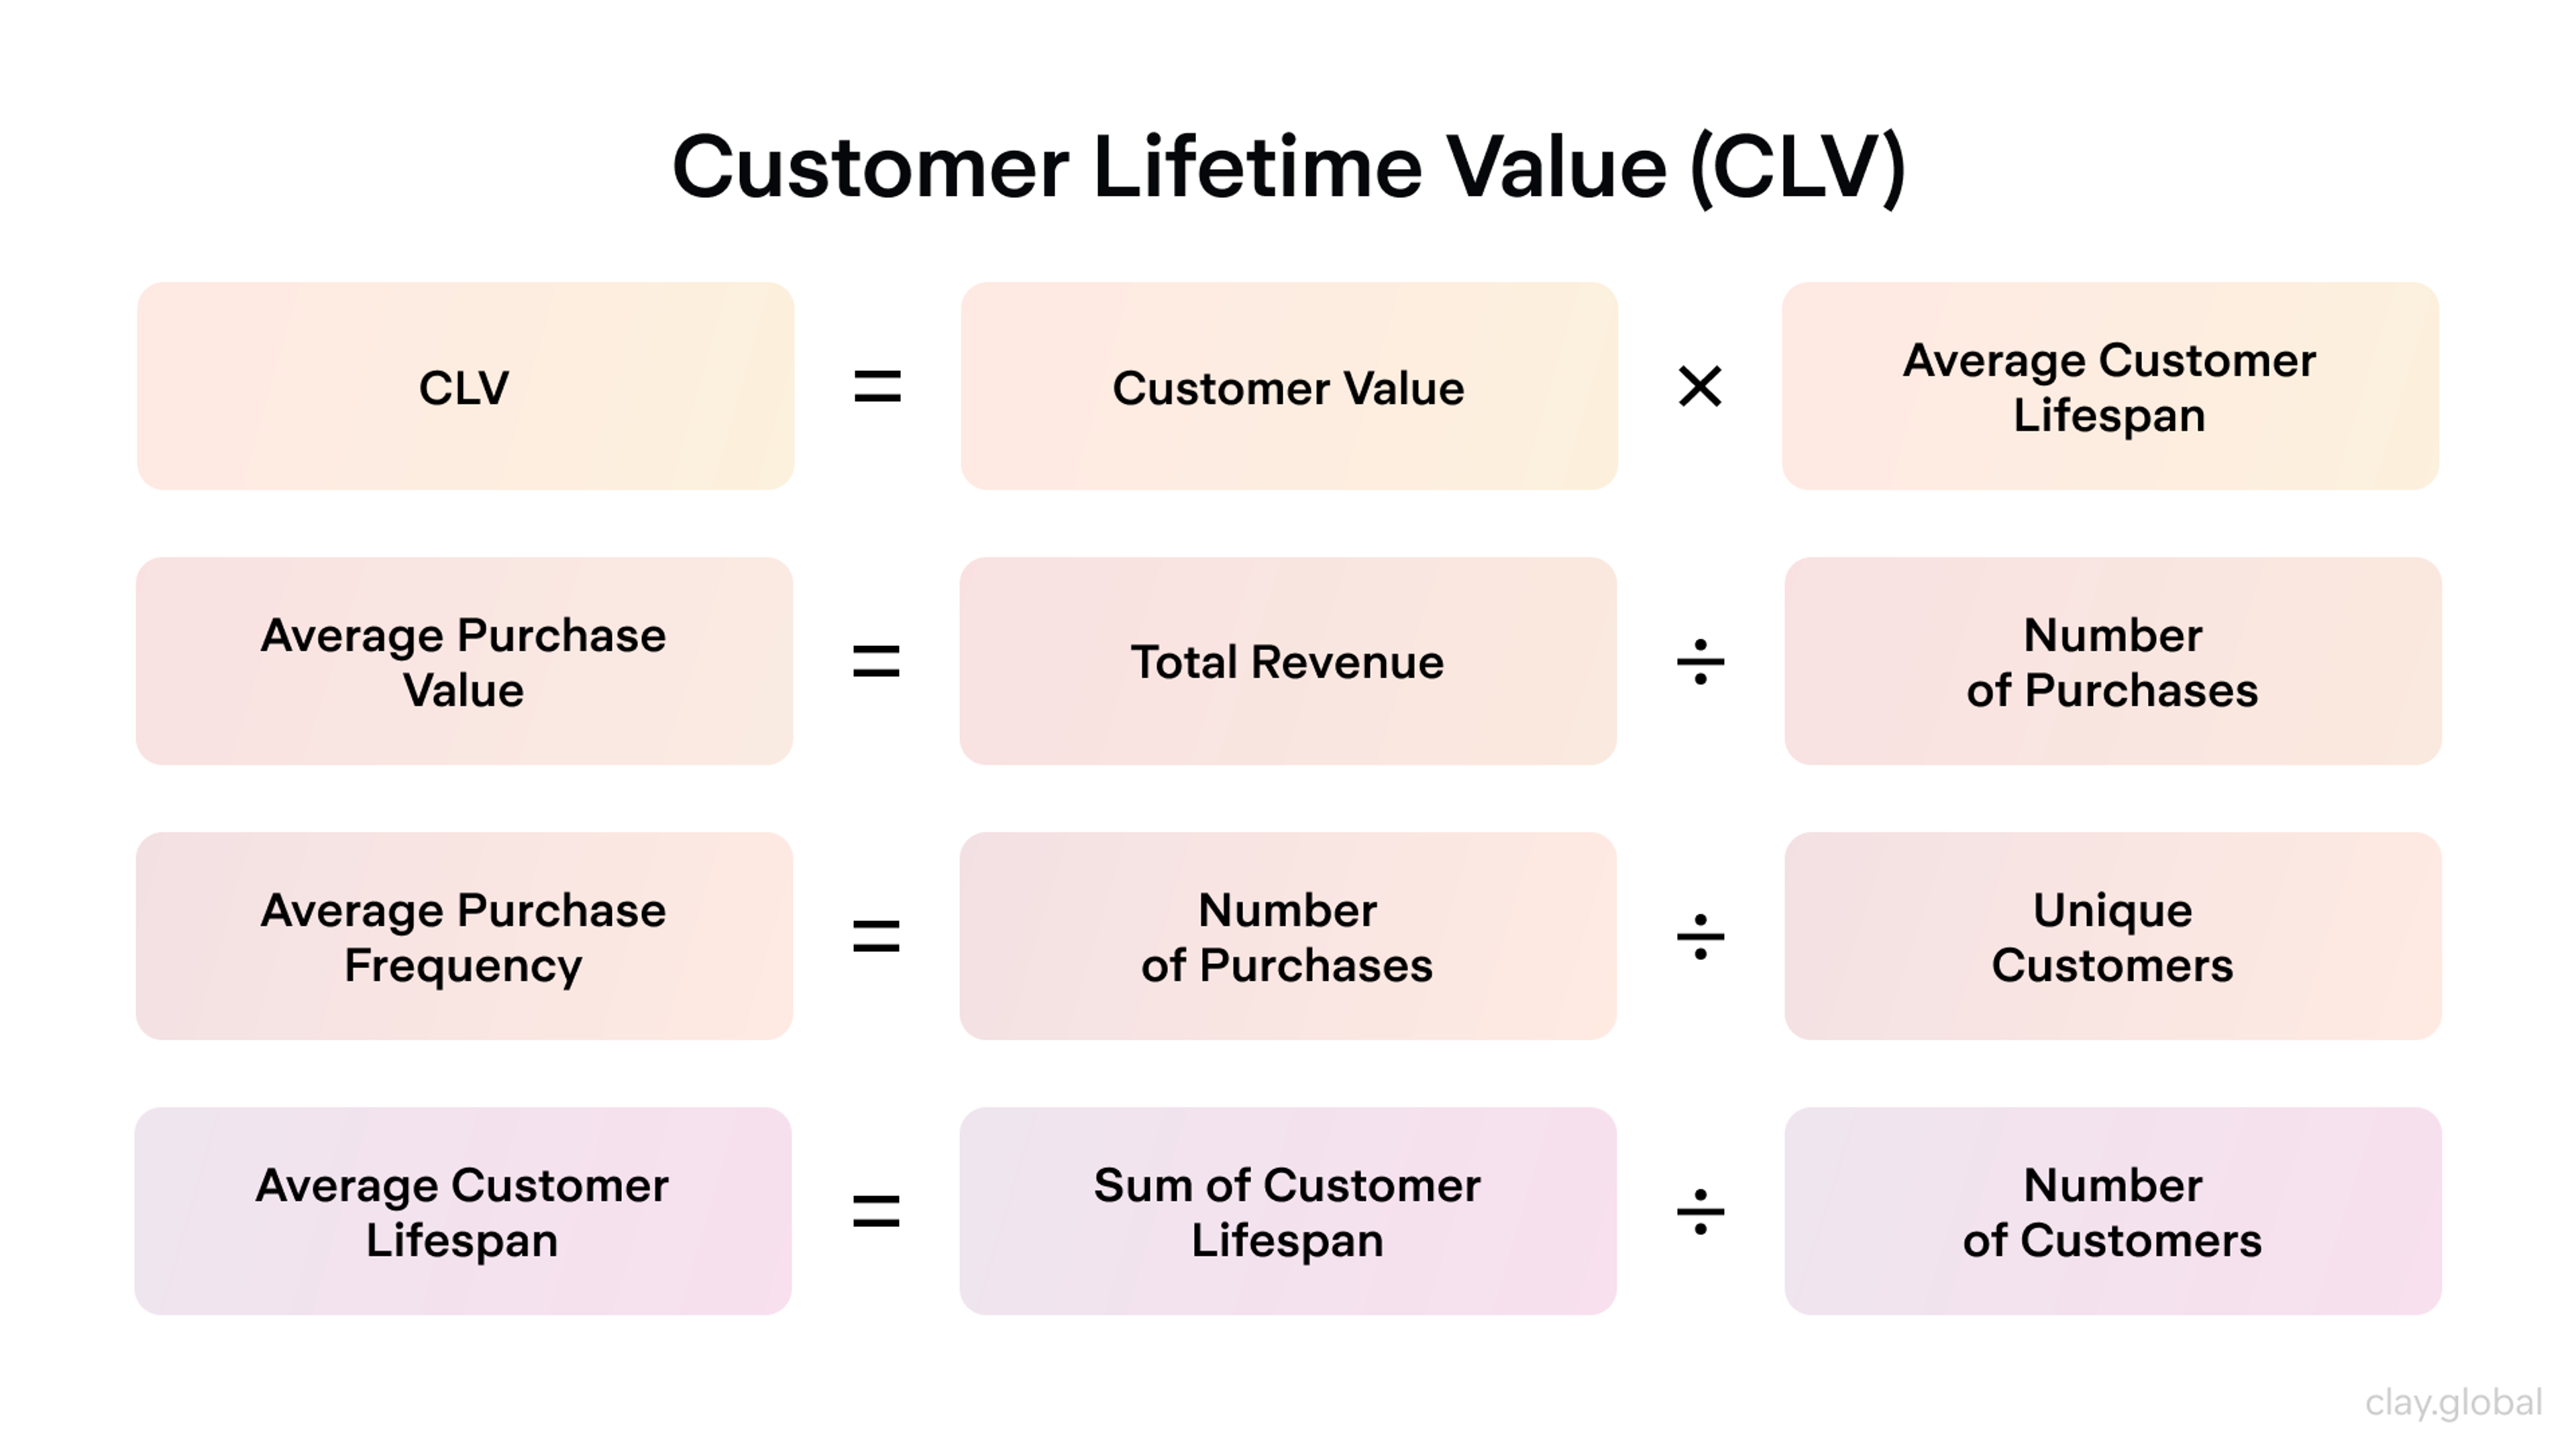
At $40 per order, four orders a year, and a three-year lifespan, each subscriber is worth $480. Compare CLV with customer acquisition cost to see how long a customer must stay before they turn profitable, and calculate it by segment rather than as one blended number.
Referral rate tracks the share of new customers who arrived through an existing customer's recommendation. It's the behavioral proof of what NPS can only predict.
NPS vs CSAT vs CES for Measuring Loyalty
All three are survey-based, and each one captures a different moment. Use them together and match each to the decision it informs.
- Use NPS to track the overall relationship over time, compare segments, and find promoters for referral programs. Send it quarterly or twice a year, never after every interaction.
- Use CSAT right after specific touchpoints, such as a delivery, an onboarding call, or a support ticket, to find which moments disappoint.
- Use CES after tasks that should feel routine, like checkout, account changes, and issue resolution, to locate the friction behind quiet churn.
Treat NPS with some caution. It became a boardroom favorite on the promise that it predicts growth better than anything else, yet NPS doesn't reliably predict revenue growth better than satisfaction-based measures. Its 11-point scale also collapses into three buckets. A customer moving from 6 to 7 changes the score, while a customer moving from 0 to 6 changes nothing.
NPS
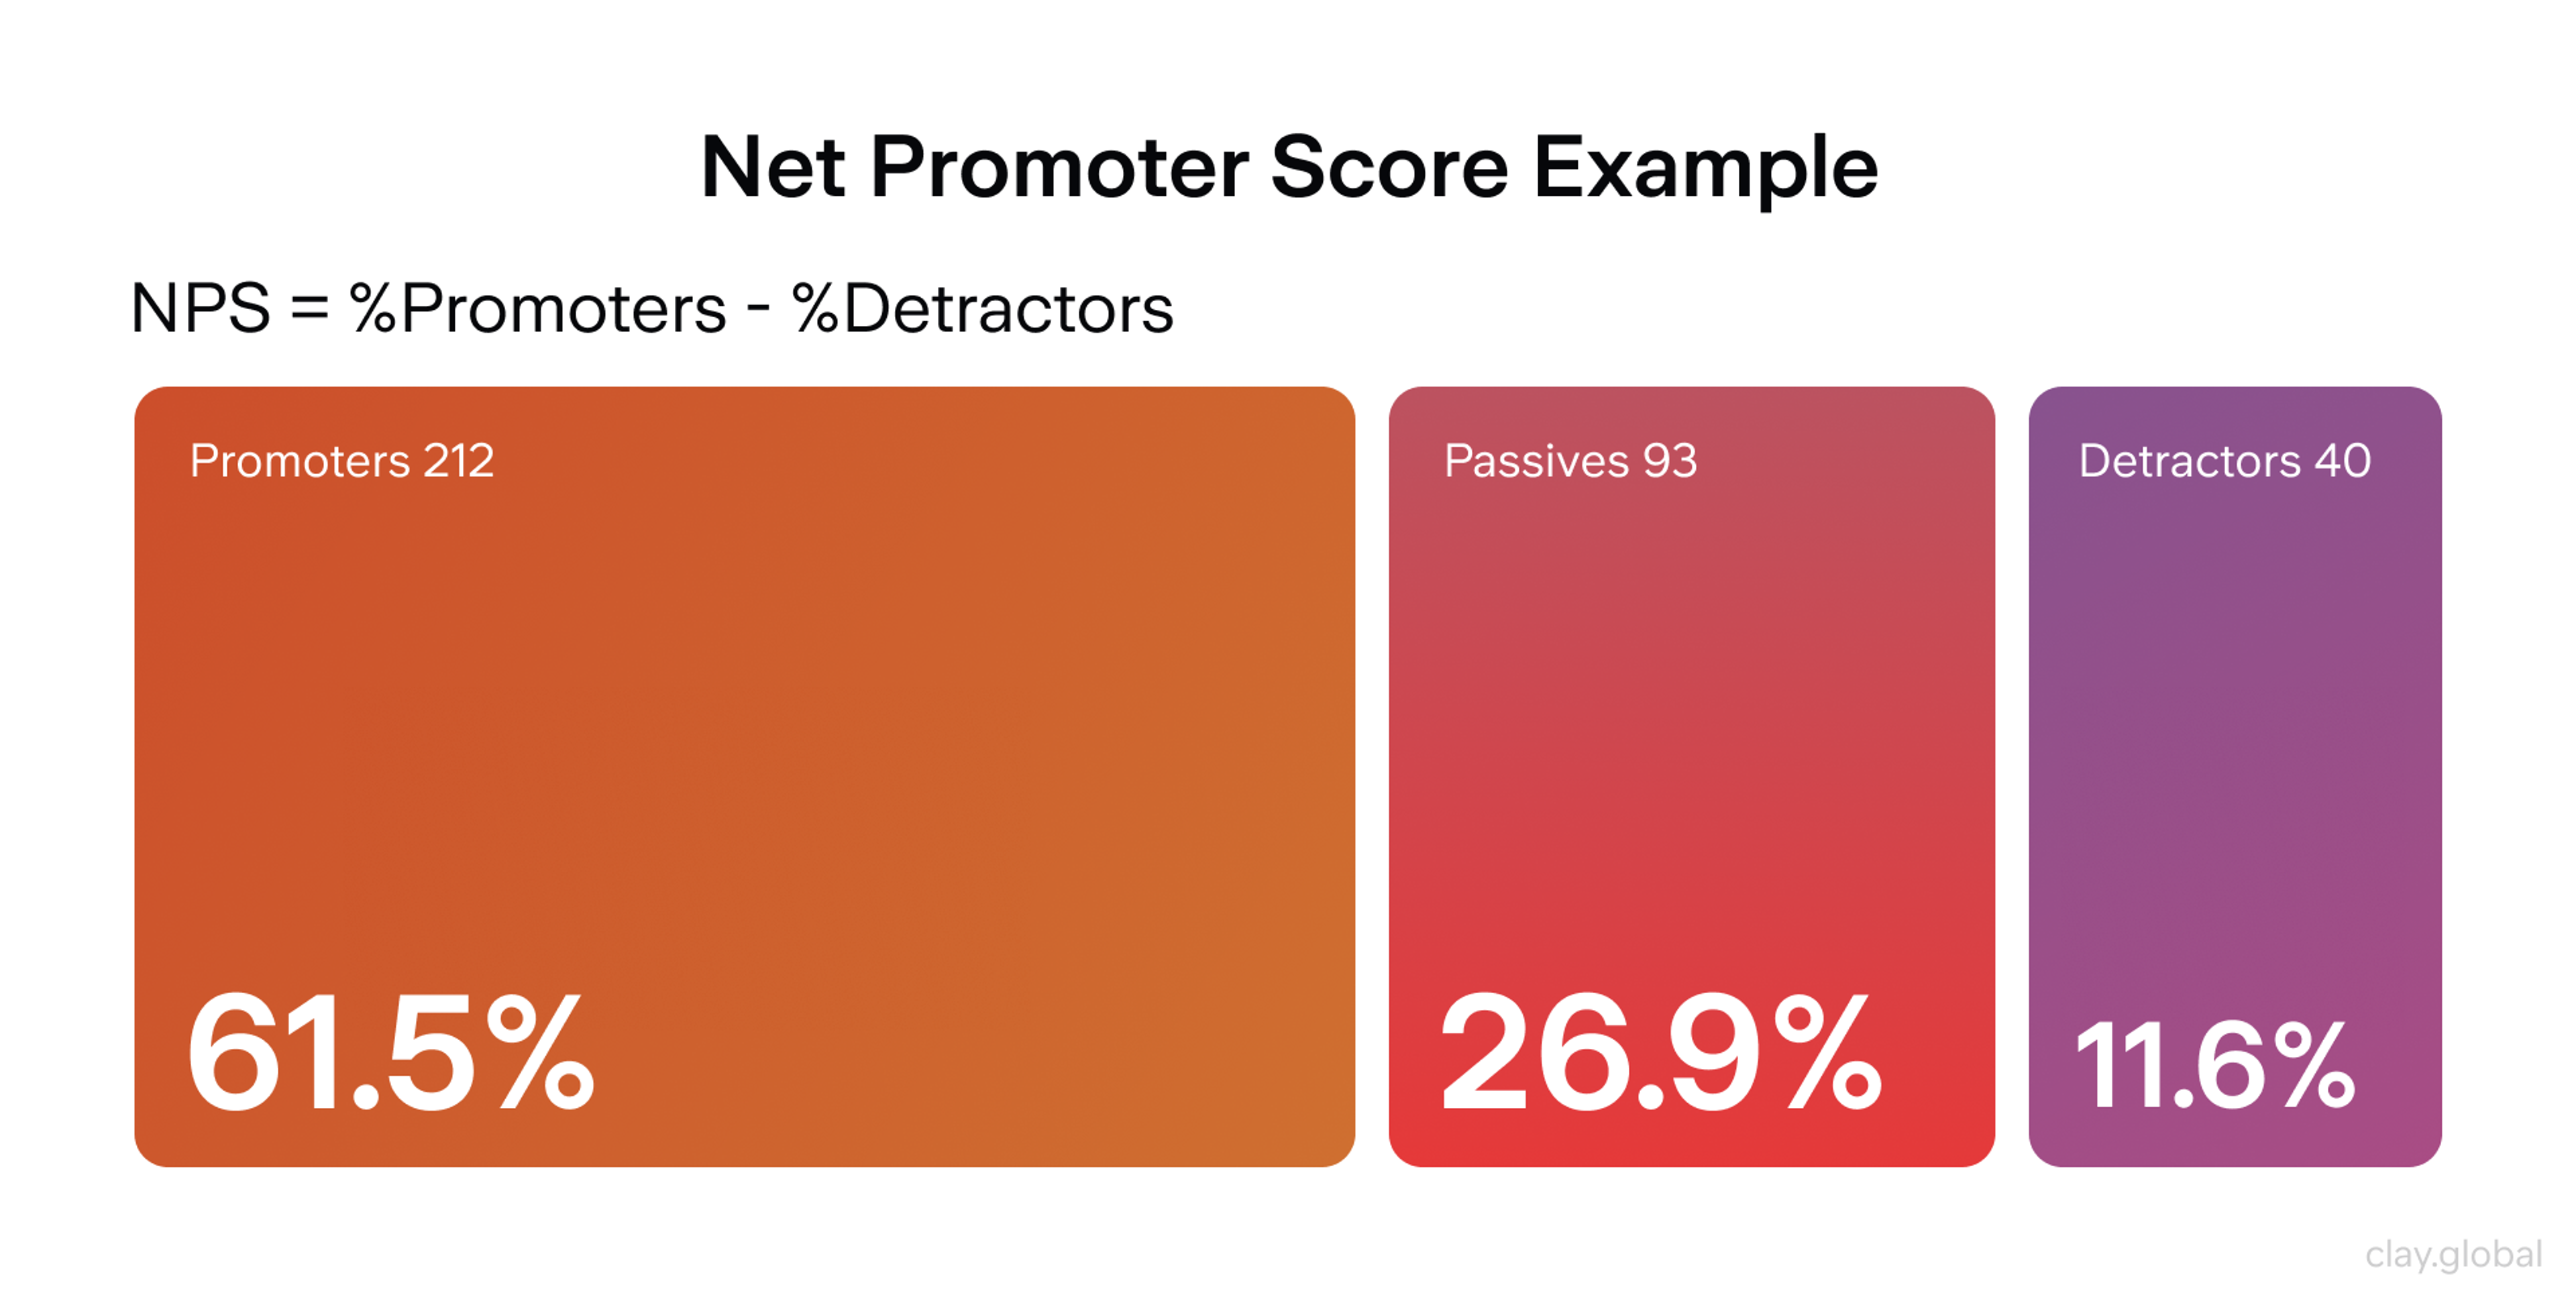
CSAT, CES, Churn Rate
Small samples make the problem worse. For a B2B company with a few dozen accounts, one response can swing NPS by several points. Read the verbatim comments and follow up personally, because the reasons behind a score carry more information than the number.
Which Loyalty Metrics Fit Your Business Model
Generic metric lists ignore the biggest variable, which is how often your customers can buy from you in the first place.
- Subscription and SaaS. Churn and revenue retention come first, since every renewal is a loyalty decision. Add CES at support and onboarding touchpoints, where many early cancellations begin.
- Ecommerce and retail. Repeat purchase rate, time between purchases, and CLV by acquisition cohort tell you whether first-time buyers become regulars.
- B2B services and agencies. Renewal rate, account expansion, and relationship NPS with qualitative follow-up matter most. Small samples make scores noisy, so conversations carry more weight than dashboards.
- Low-frequency purchases. For furniture, cars, real estate, or weddings, repeat purchase rate is close to meaningless. Track referral rate, review volume, and NPS instead, since advocacy is the loyalty you can observe.
How to Set Up Customer Loyalty Measurement
Start with one metric per layer. Three well-tracked numbers beat ten that nobody reviews, and a typical starting set is retention or repeat purchase rate, NPS or CES, and CLV.
Connect your data around a single customer ID. Purchase history sits in your commerce or billing system, feedback sits in your survey tool, and support history sits somewhere else again. Without a shared identifier, you can't see that your detractors are also your highest-churn segment.
How to Set Up Customer Loyalty Measurement
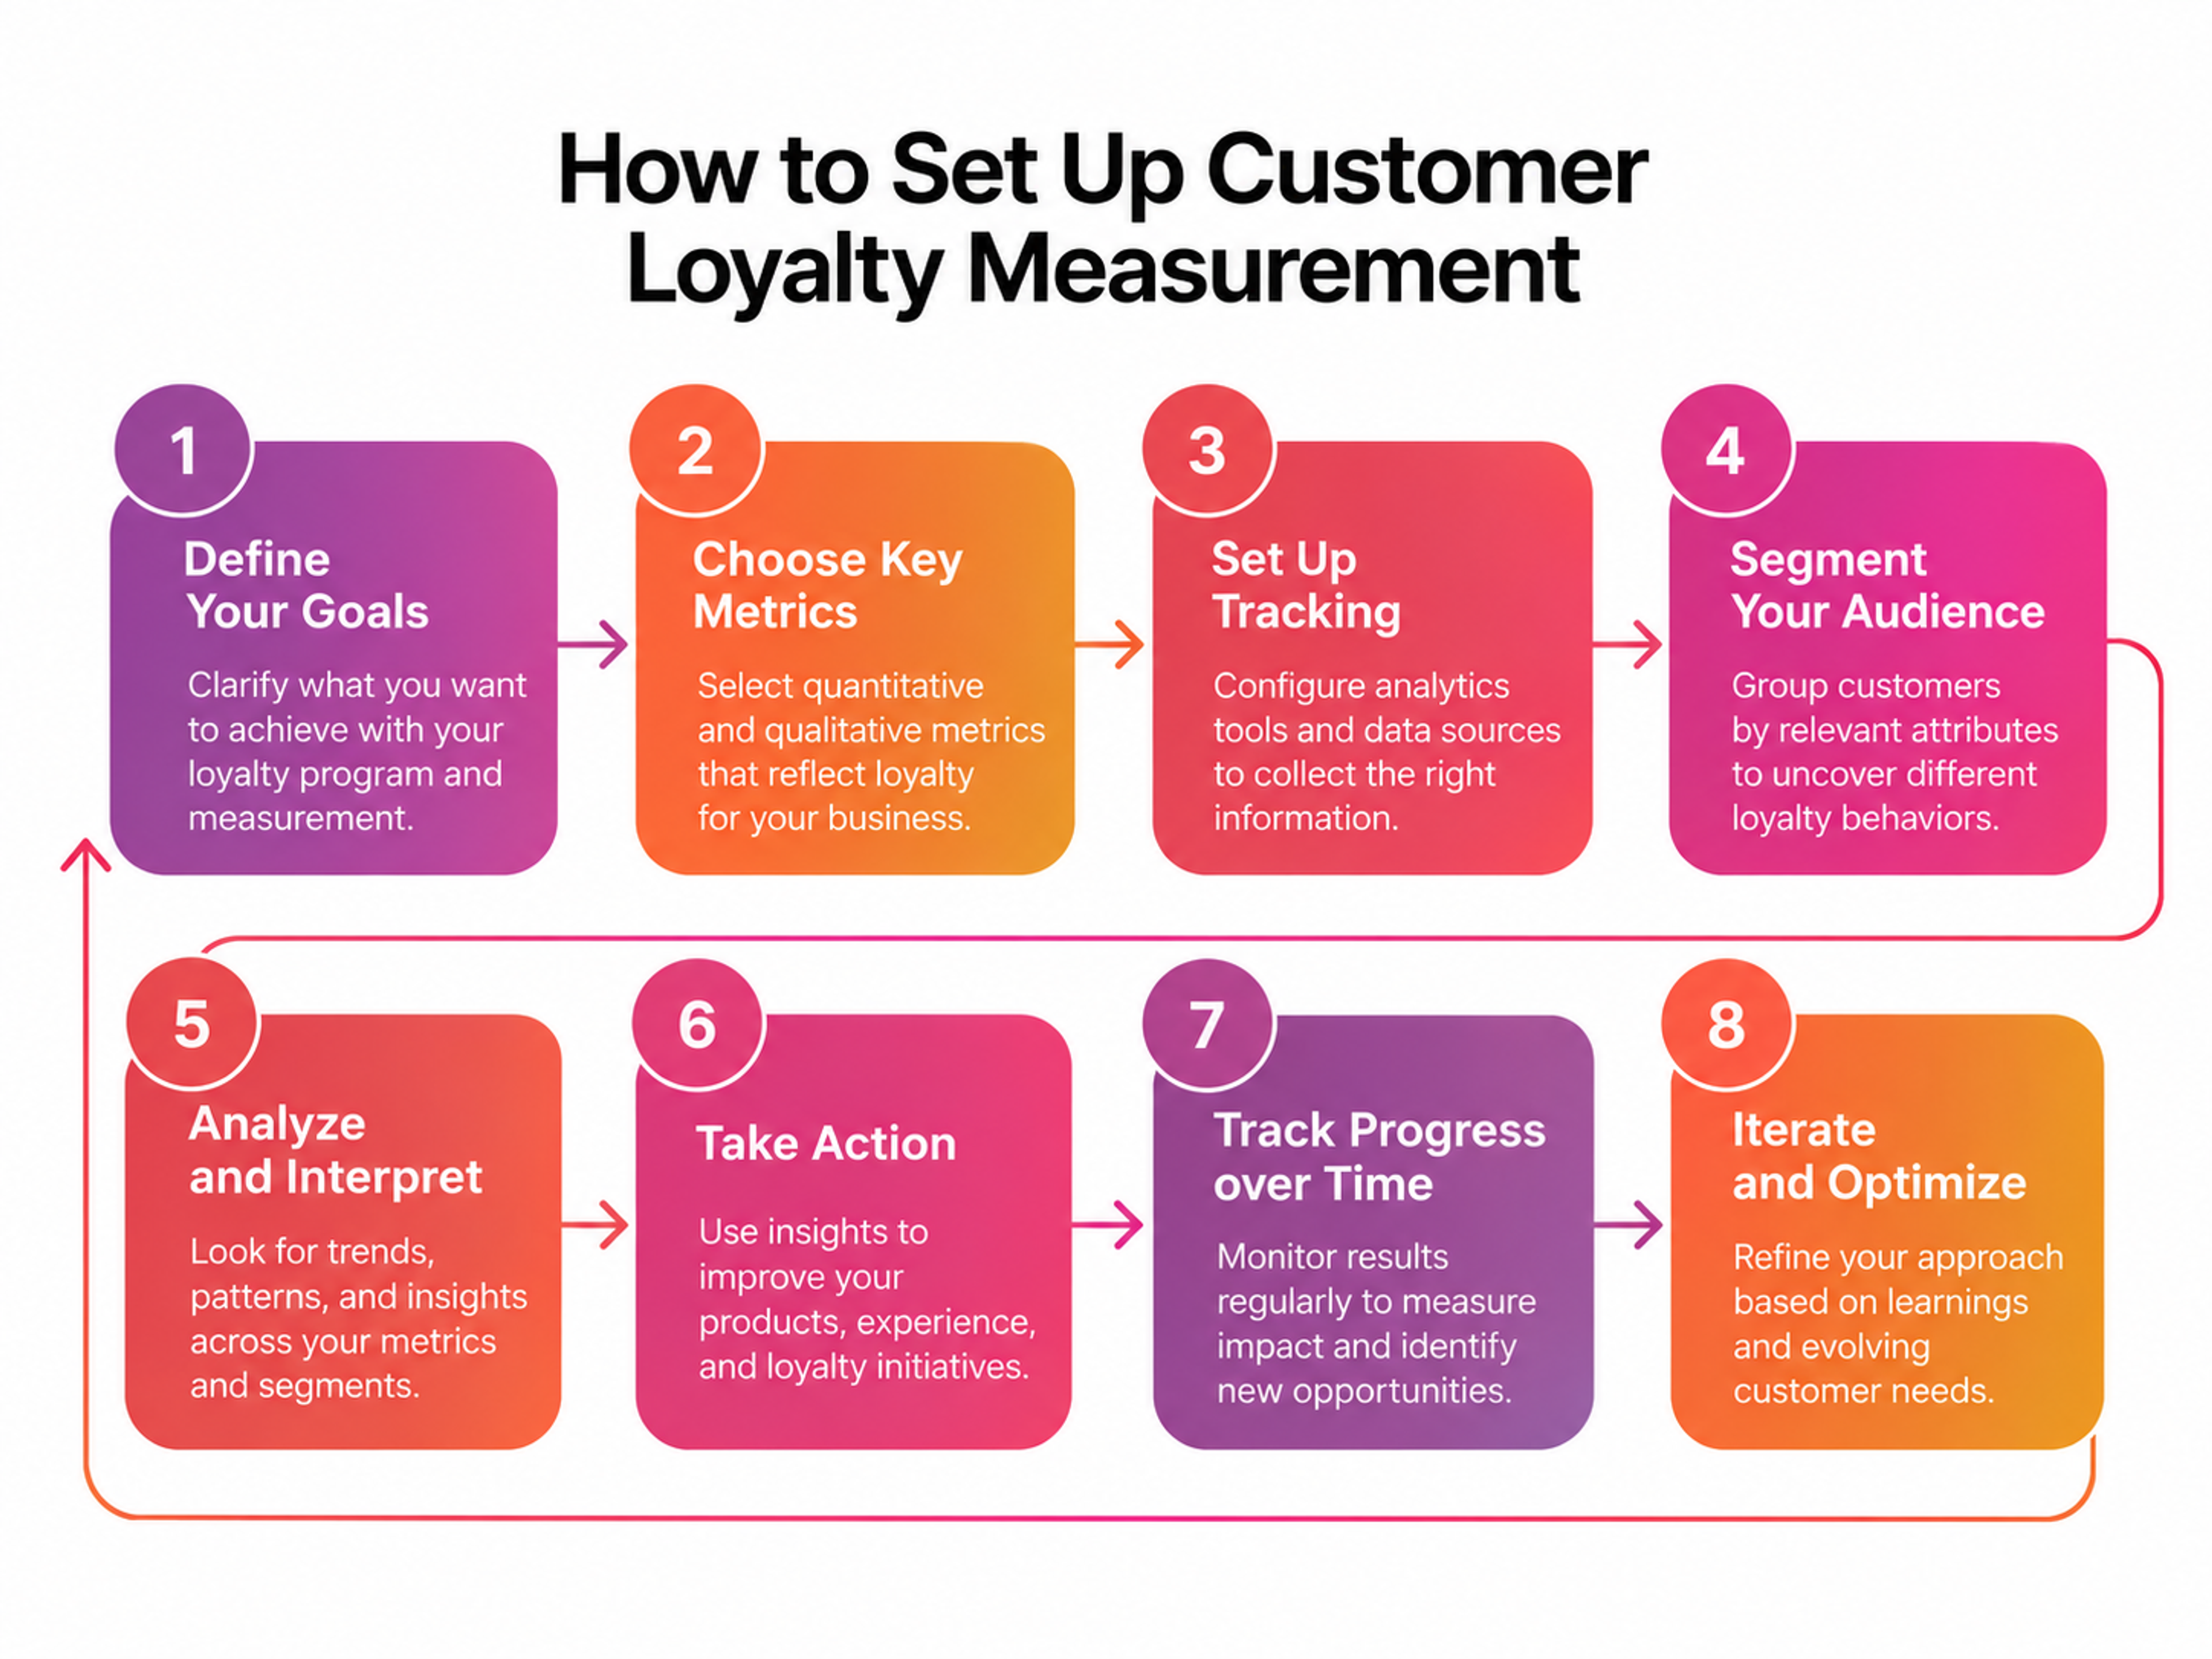
Track cohorts instead of averages. Group customers by the month or channel through which they arrived, then watch each cohort's retention curve. A blended retention rate can hold steady while every new cohort performs worse than the last, because older customers prop up the average.
Set a cadence and close the loop. Review behavioral metrics monthly, relationship NPS quarterly or twice a year, and CSAT or CES continuously after key interactions. Contact detractors within days, and tell customers what changed because of their feedback.
Common Measurement Mistakes
- Surveying only after good moments. Sending NPS right after a successful delivery inflates the score, so sample across the whole journey.
- Reading retention as loyalty. In markets with high switching costs, retention can stay strong while attitudinal scores fall. Watch for that gap.
- Counting loyal customers without counting margin. Long-tenured customers often expect discounts and extra service, so tenure and profitability don't always rise together. Segment loyalty metrics by profitability before you decide where to invest.
- Rewording the survey question. Changing an NPS or CSAT question breaks comparability with every earlier period.
How Brand Experience and UX Design Shape Customer Loyalty
Loyalty metrics record the results of hundreds of small experiences. Design shapes most of them.
Effort is the clearest link. Every extra field at checkout, every confusing settings screen, and every support flow that sends people in circles adds friction customers remember when it's time to reorder or renew. CES catches some of it, and churn catches the rest months later.
When Clay redesigned the Serena & Lily ecommerce experience, the team rebuilt the purchase flow from adding an item to completing the order, because every step a repeat buyer has to relearn gives them a reason to shop elsewhere.
Serena & Lily by Clay
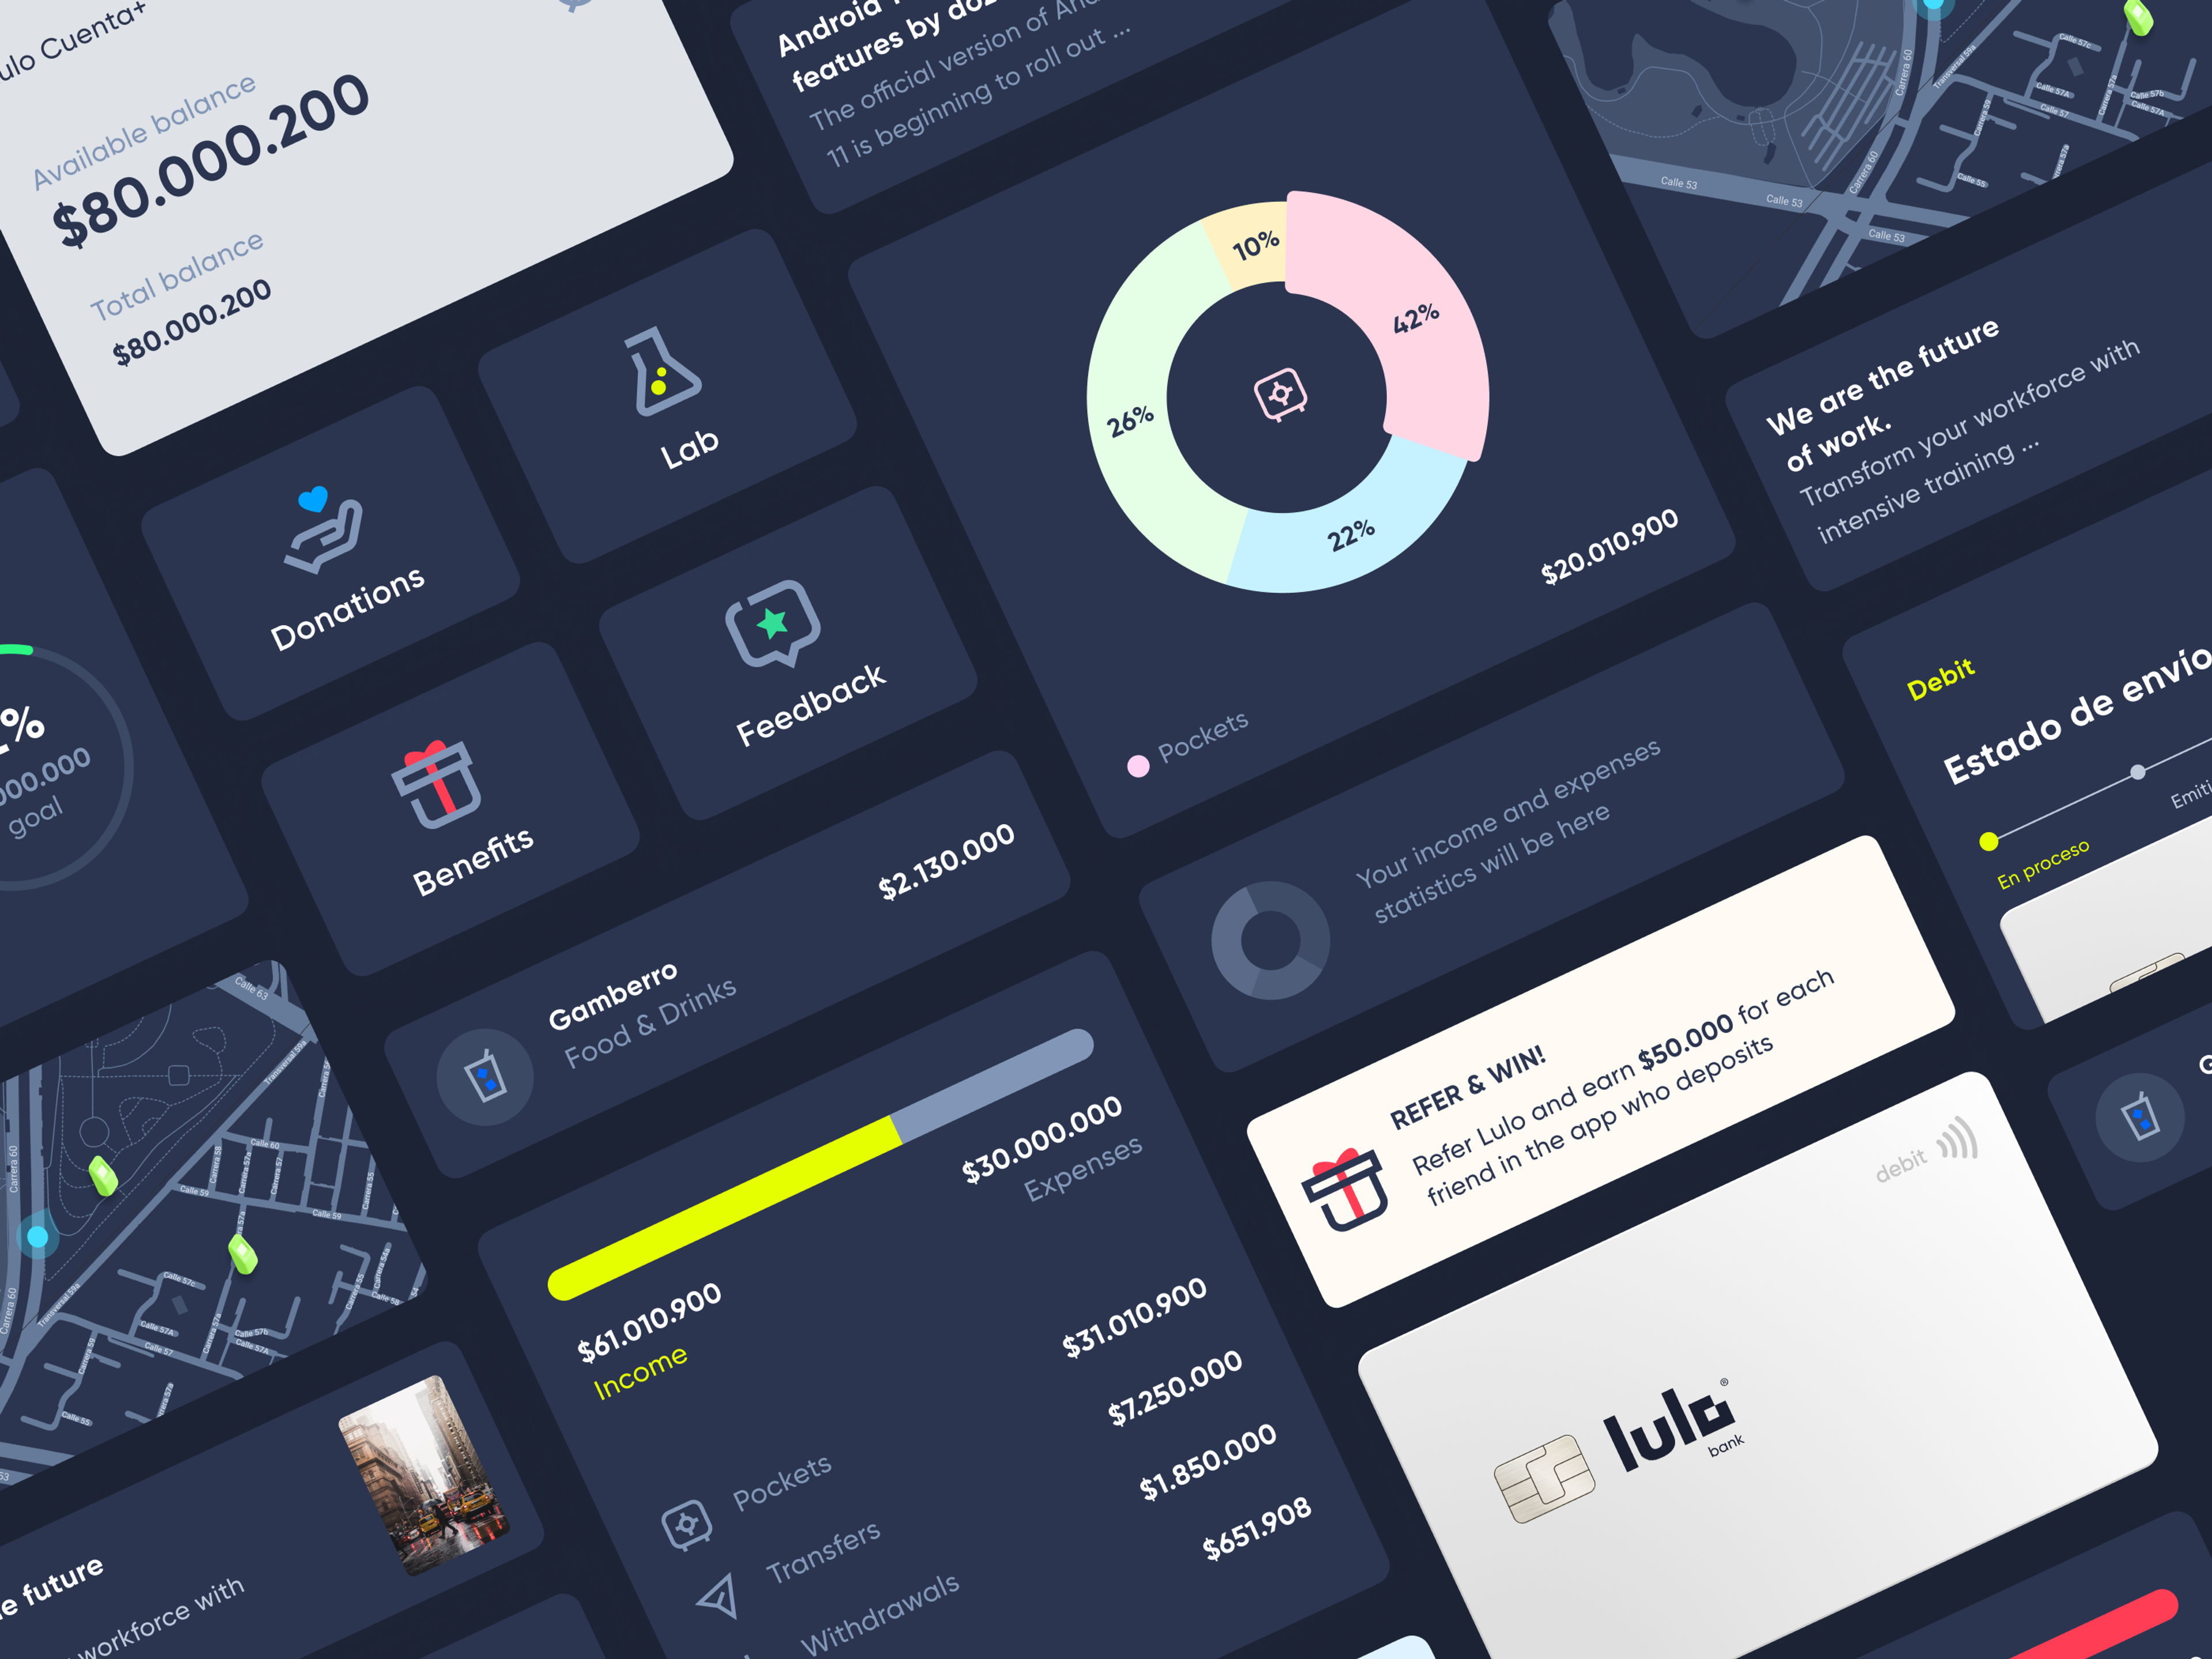
Onboarding sets the trajectory. Customers decide early whether a product fits their routine, so early-cohort churn often traces back to the first few sessions. For Lulo Bank, Colombia's first fully digital bank, the app is the only branch customers ever visit. Clay designed every screen to be direct and intuitive, with micro-interactions that make routine banking feel responsive.
Lulo Bank by Clay
Brand consistency builds the attitudinal side of loyalty. When identity, tone, and visual language hold steady across the app, site, packaging, and support, customers recognize the brand faster and trust it sooner. A rebrand that changes the look without fixing the experience rarely moves loyalty scores, which is why the right branding agency treats brand and product experience as one system.
Loyalty programs are a design problem too. Over a multi-year partnership, Clay designed the Joe & The Juice app, gamifying the points system with 3D brand elements and adding in-app loyalty cards for routine customers. Once customers started using the loyalty app, they visited stores 2.4 times as often. Reward mechanics matter, and so does how much people enjoy opening the app that holds them.
Joe & The Juice by Clay
Strategies to Increase Customer Loyalty
Each strategy below targets a specific metric, so you can test whether it worked.
Remove Effort From Repeat Tasks
This moves CES, repeat purchase rate, and purchase frequency. Some of the fastest loyalty gains come from making the second purchase quicker than the first, through saved preferences, one-tap reorders, and smart defaults. For the grocery delivery app JOKR, Clay designed a smart basket that predicts which products a customer is likely to need, so returning shoppers can rebuild a regular order without browsing every category.
JOKR by Clay
Match Rewards to the Purchase Rhythm
This moves purchase frequency and retention. Rewards work when they fit how often people naturally buy. Weekly coffee buyers respond to quick, frequent perks, while annual gear buyers need something that accumulates. REI's lifetime co-op membership pays out an annual member reward on eligible full-price purchases, which encourages members to buy at full price from REI instead of hunting for the lowest deal elsewhere. Be wary of programs built mostly on discounts, which train customers to wait for the next promotion.
Give Customers a Reason Beyond Price
This moves NPS, referral rate, and emotional loyalty. Price is the easiest loyalty driver for a competitor to copy. Patagonia's Worn Wear program repairs, resells, and trades in used gear, giving customers a reason to stay with the brand that has nothing to do with discounts. It fits the company's environmental stance, and customers who share that stance treat their purchases as a statement of what they value.
Make Progress Visible
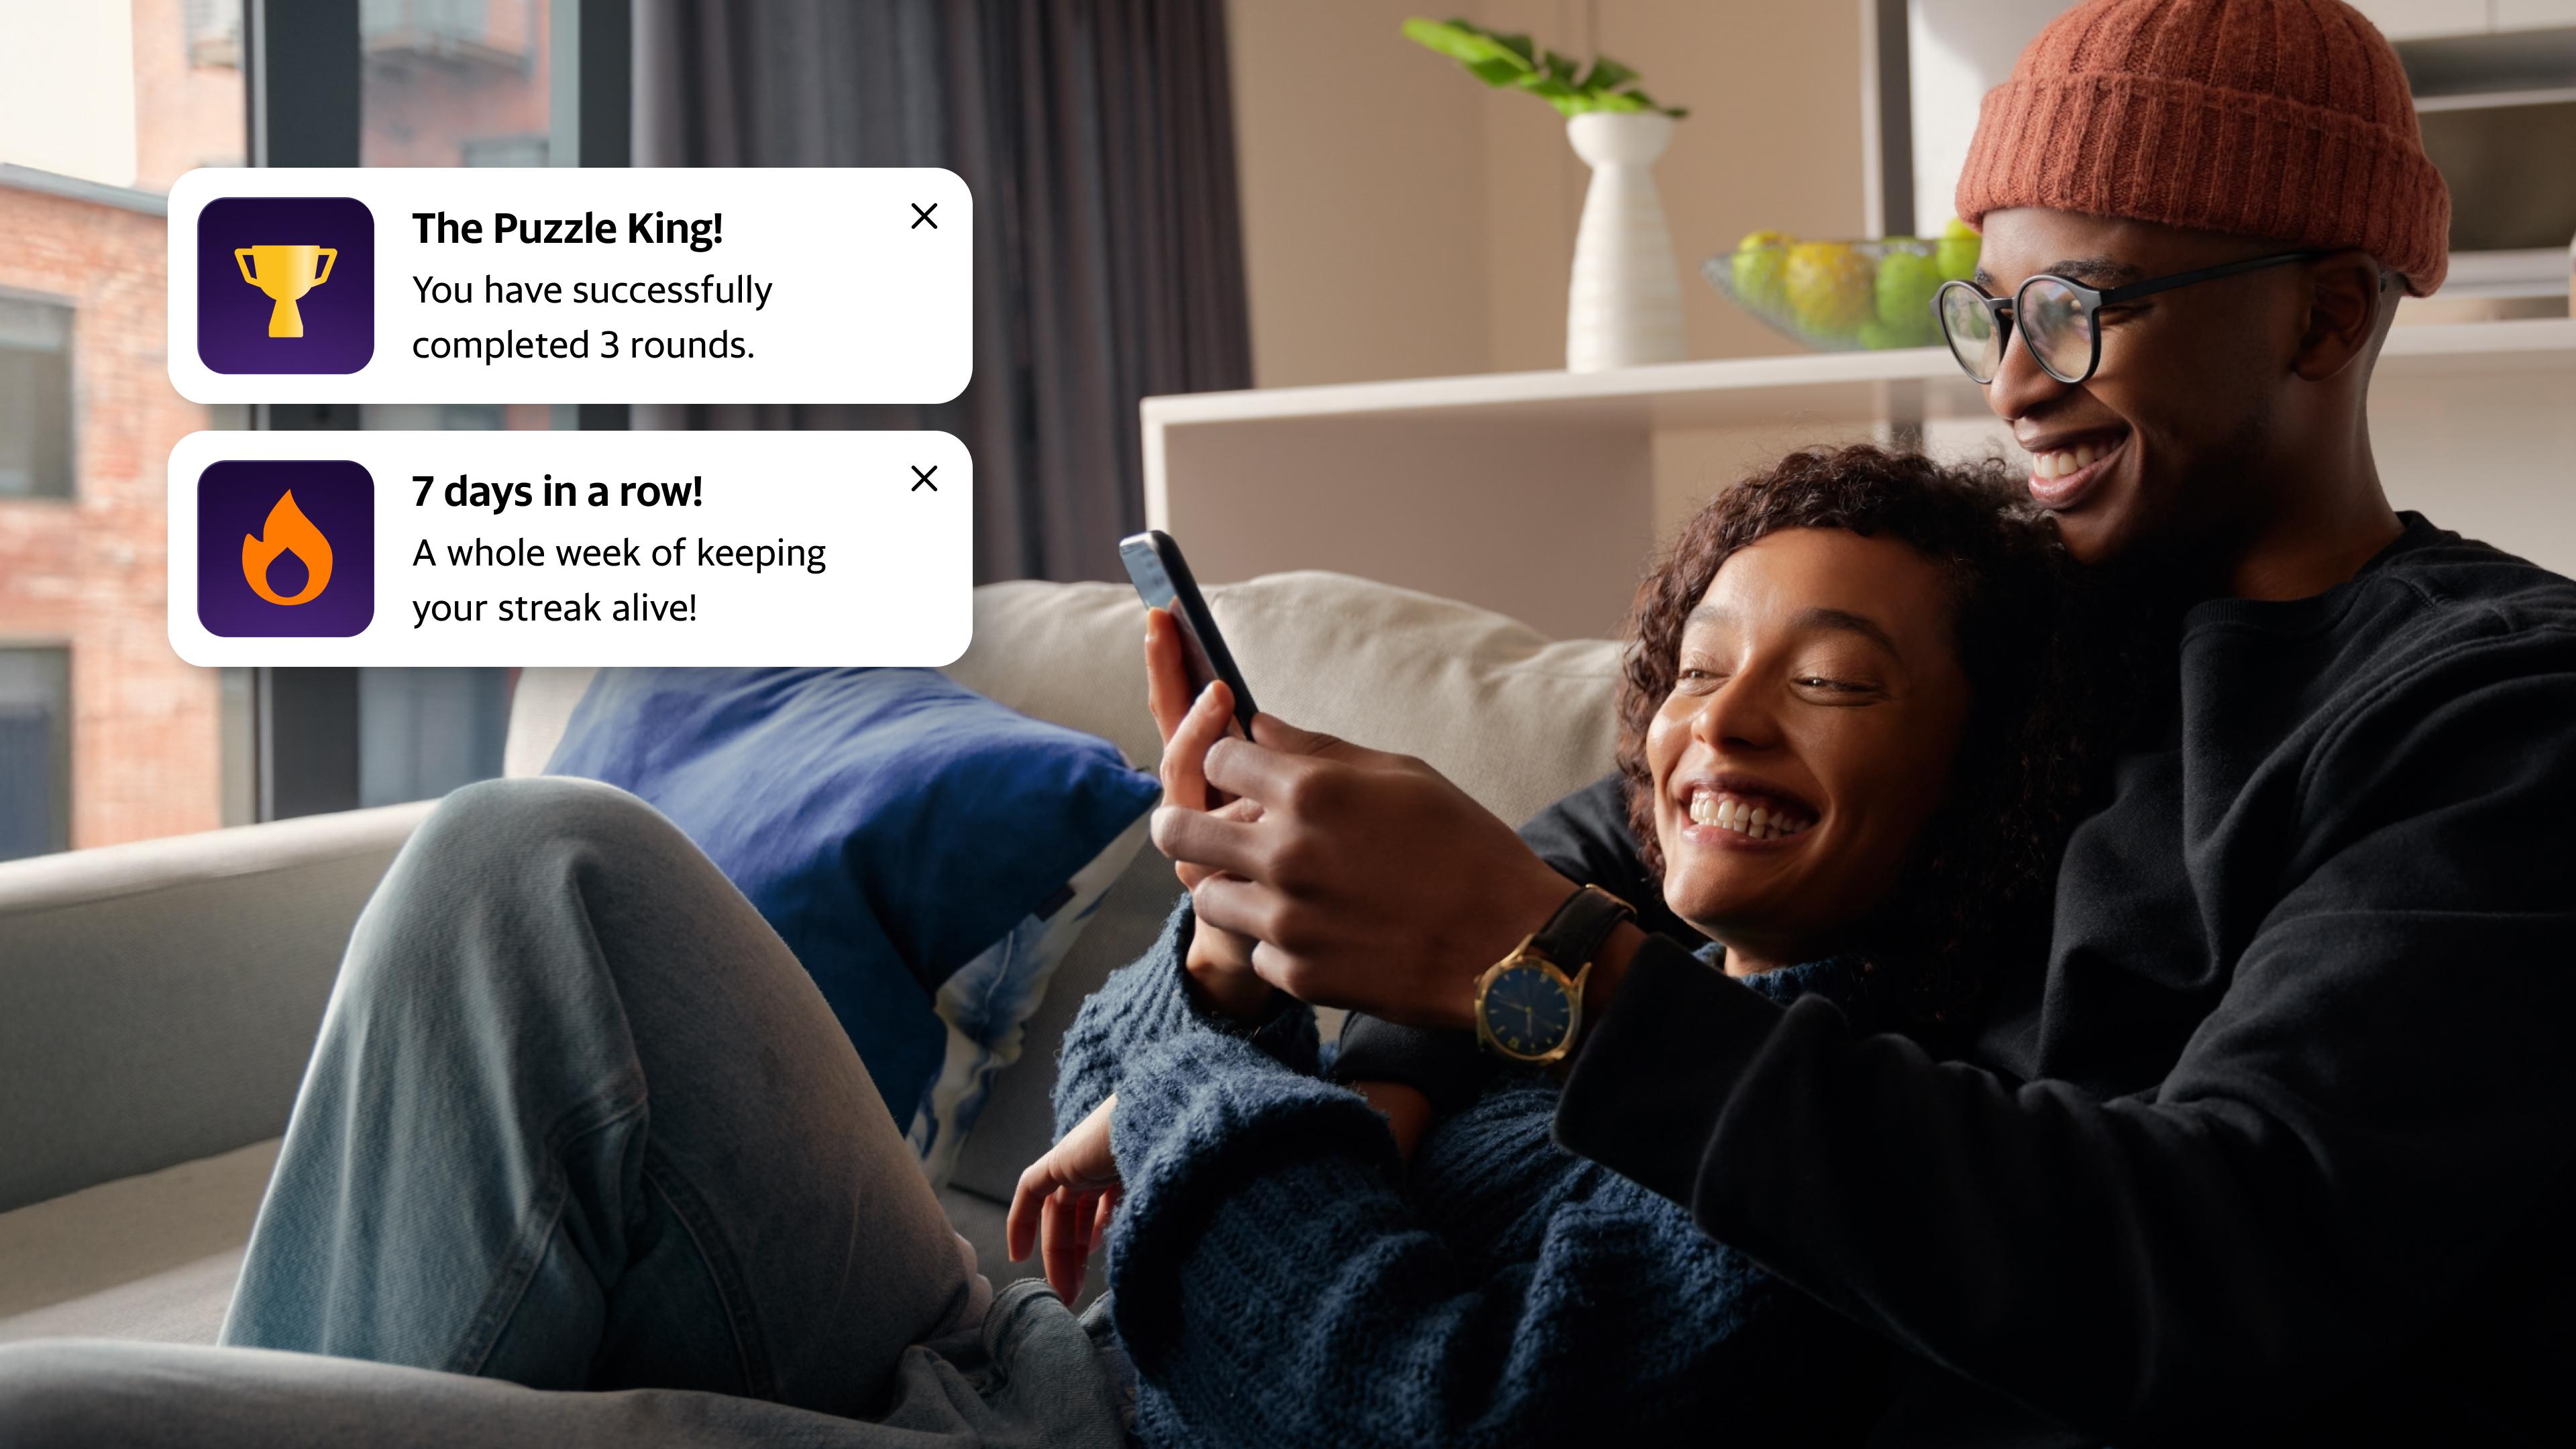
This moves engagement metrics and active usage. People return to things that show them how far they've come. Tiers, streaks, and milestones give customers a reason to open the app between purchases. For Yahoo! Games, Clay added a rewards system built around achievement and friendly competition that motivates players to come back for the next milestone.
Yahoo! Games by Clay
Follow Up With Detractors and Lapsed Customers
This moves churn and NPS. A detractor who hears back within days is a churn risk you can still address. Ask what went wrong, fix what you can, and tell them what changed. Run the same play for customers whose purchase gap has stretched well past their usual rhythm.
Report Value Before B2B Renewals Come Up
This moves renewal rate and account expansion. B2B loyalty depends on clients seeing results without having to ask. Set clear expectations at kickoff, share regular updates on what you've delivered and what it achieved, and agree on a roadmap for the next phase. A client who can explain your impact to their own leadership has every reason to renew.
Give us all the hard work and focus on what matters most: measuring the results. Sounds good? Let's talk.
Read more
FAQ
What is a good customer retention rate?
There's no universal target. Retention depends on industry, price point, and purchase frequency, so a rate that's strong for a furniture retailer would be alarming for a SaaS product. Your own history is the most useful benchmark. Compare each new cohort's retention curve with earlier cohorts at the same age, and treat a declining trend as the signal worth acting on.
What's the difference between repeat purchase rate and retention rate?
Retention rate counts customers who stayed active through a period, even if they bought only once. Repeat purchase rate counts customers who bought more than once. A subscription business can post high retention with one annual payment per customer, while a retailer needs repeat purchases to show any retention at all.
Can a company have a high NPS and high churn at the same time?
Yes. It usually means customers like the brand but something in the experience pushes them out, such as a price increase, a missing feature, or a frustrating renewal process. It can also mean the survey reaches only engaged customers while silent ones leave. Check who's responding before you trust the score.
How often should you send an NPS survey?
Send a relationship NPS survey quarterly or twice a year to the same customer segments, so results stay comparable. Avoid surveying the same person more often than that. Use CSAT or CES for feedback tied to specific interactions.
Which customer loyalty metric should a startup track first?
Start with cohort retention. It shows whether the product keeps the customers it attracts, which matters before any other loyalty question. Add a short CES or CSAT question at onboarding next, since early friction is where many startups lose people.
How do you measure customer loyalty with a small customer base?
With fewer than a hundred customers, percentages swing too much to trust. Track renewal and expansion account by account, run short interviews instead of surveys, and record the reasons customers give for staying or leaving. Patterns in those reasons are more reliable than any score.
Do you need a loyalty program to build customer loyalty?
No. A program can strengthen loyalty that already exists, but it can't create it from nothing. If customers stay only for the points, you have transactional loyalty that ends with the program. Fix the core experience first, then design rewards that fit your purchase rhythm.
Do discounts hurt customer loyalty?
Frequent discounts tend to attract price-sensitive customers and train existing ones to wait for the next sale. Occasional, targeted offers for lapsed or high-value customers carry less risk. Watch whether repeat purchases cluster around promotions, since that pattern means loyalty depends on price.
What is net revenue retention?
Net revenue retention measures how much recurring revenue you keep from existing customers over a period. It adds upgrades and expansion, then subtracts downgrades and churn. A figure above 100% means existing customers grow in value even after losses. It's a core loyalty metric for SaaS and other subscription businesses.
How long does it take for loyalty metrics to reflect a redesign?
CSAT and CES can shift within weeks of a change to a specific flow. Retention and repeat purchase rate take longer, often a full purchase cycle or more, because customers have to come back before the data can show it. Compare cohorts acquired before and after the change instead of reading the overall average.
Is customer loyalty the same as customer satisfaction?
No. Satisfaction describes how a customer felt about an experience, while loyalty describes what they do next and whether they'd choose you again. Satisfied customers still switch when a competitor offers a better deal or a smoother experience, which is why satisfaction scores alone overstate loyalty.
Conclusion
Customer loyalty is the sum of many small experiences, and every metric you track is a way of seeing them more clearly. Retention shows whether customers stay, sentiment shows whether they'd choose you again, and lifetime value shows whether the relationship pays off. Read together, they tell you more than any single score, especially when they disagree.
The companies that keep customers longest treat loyalty as something they design, rather than something they buy with discounts. They make the second purchase easier than the first, keep their brand consistent everywhere customers meet it, and listen closely when the numbers start to slip. Measure what matters, act on what it shows, and loyalty tends to follow.


About Clay
Clay is a UI/UX design & branding agency in San Francisco. We team up with startups and leading brands to create transformative digital experience. Clients: Facebook, Slack, Google, Amazon, Credit Karma, Zenefits, etc.
Learn moreAbout Clay
Clay is a UI/UX design & branding agency in San Francisco. We team up with startups and leading brands to create transformative digital experience. Clients: Facebook, Slack, Google, Amazon, Credit Karma, Zenefits, etc.
Learn more