
A brand has always been powerful, but it's hard to measure. Performance marketers point to click-through rates and return on ad spend. Brand teams show mood boards and hope everyone believes the story. This creates tension. Leaders want proof that brand investments work to gain valuable insights. Brand teams feel reduced to defending their existence with vanity metrics.
The tension intensifies when the brand identity lacks clarity. If identity is inconsistent in who you are, what you stand for, and how you look, sound, and behave, results grow noisy and attribution becomes messy.
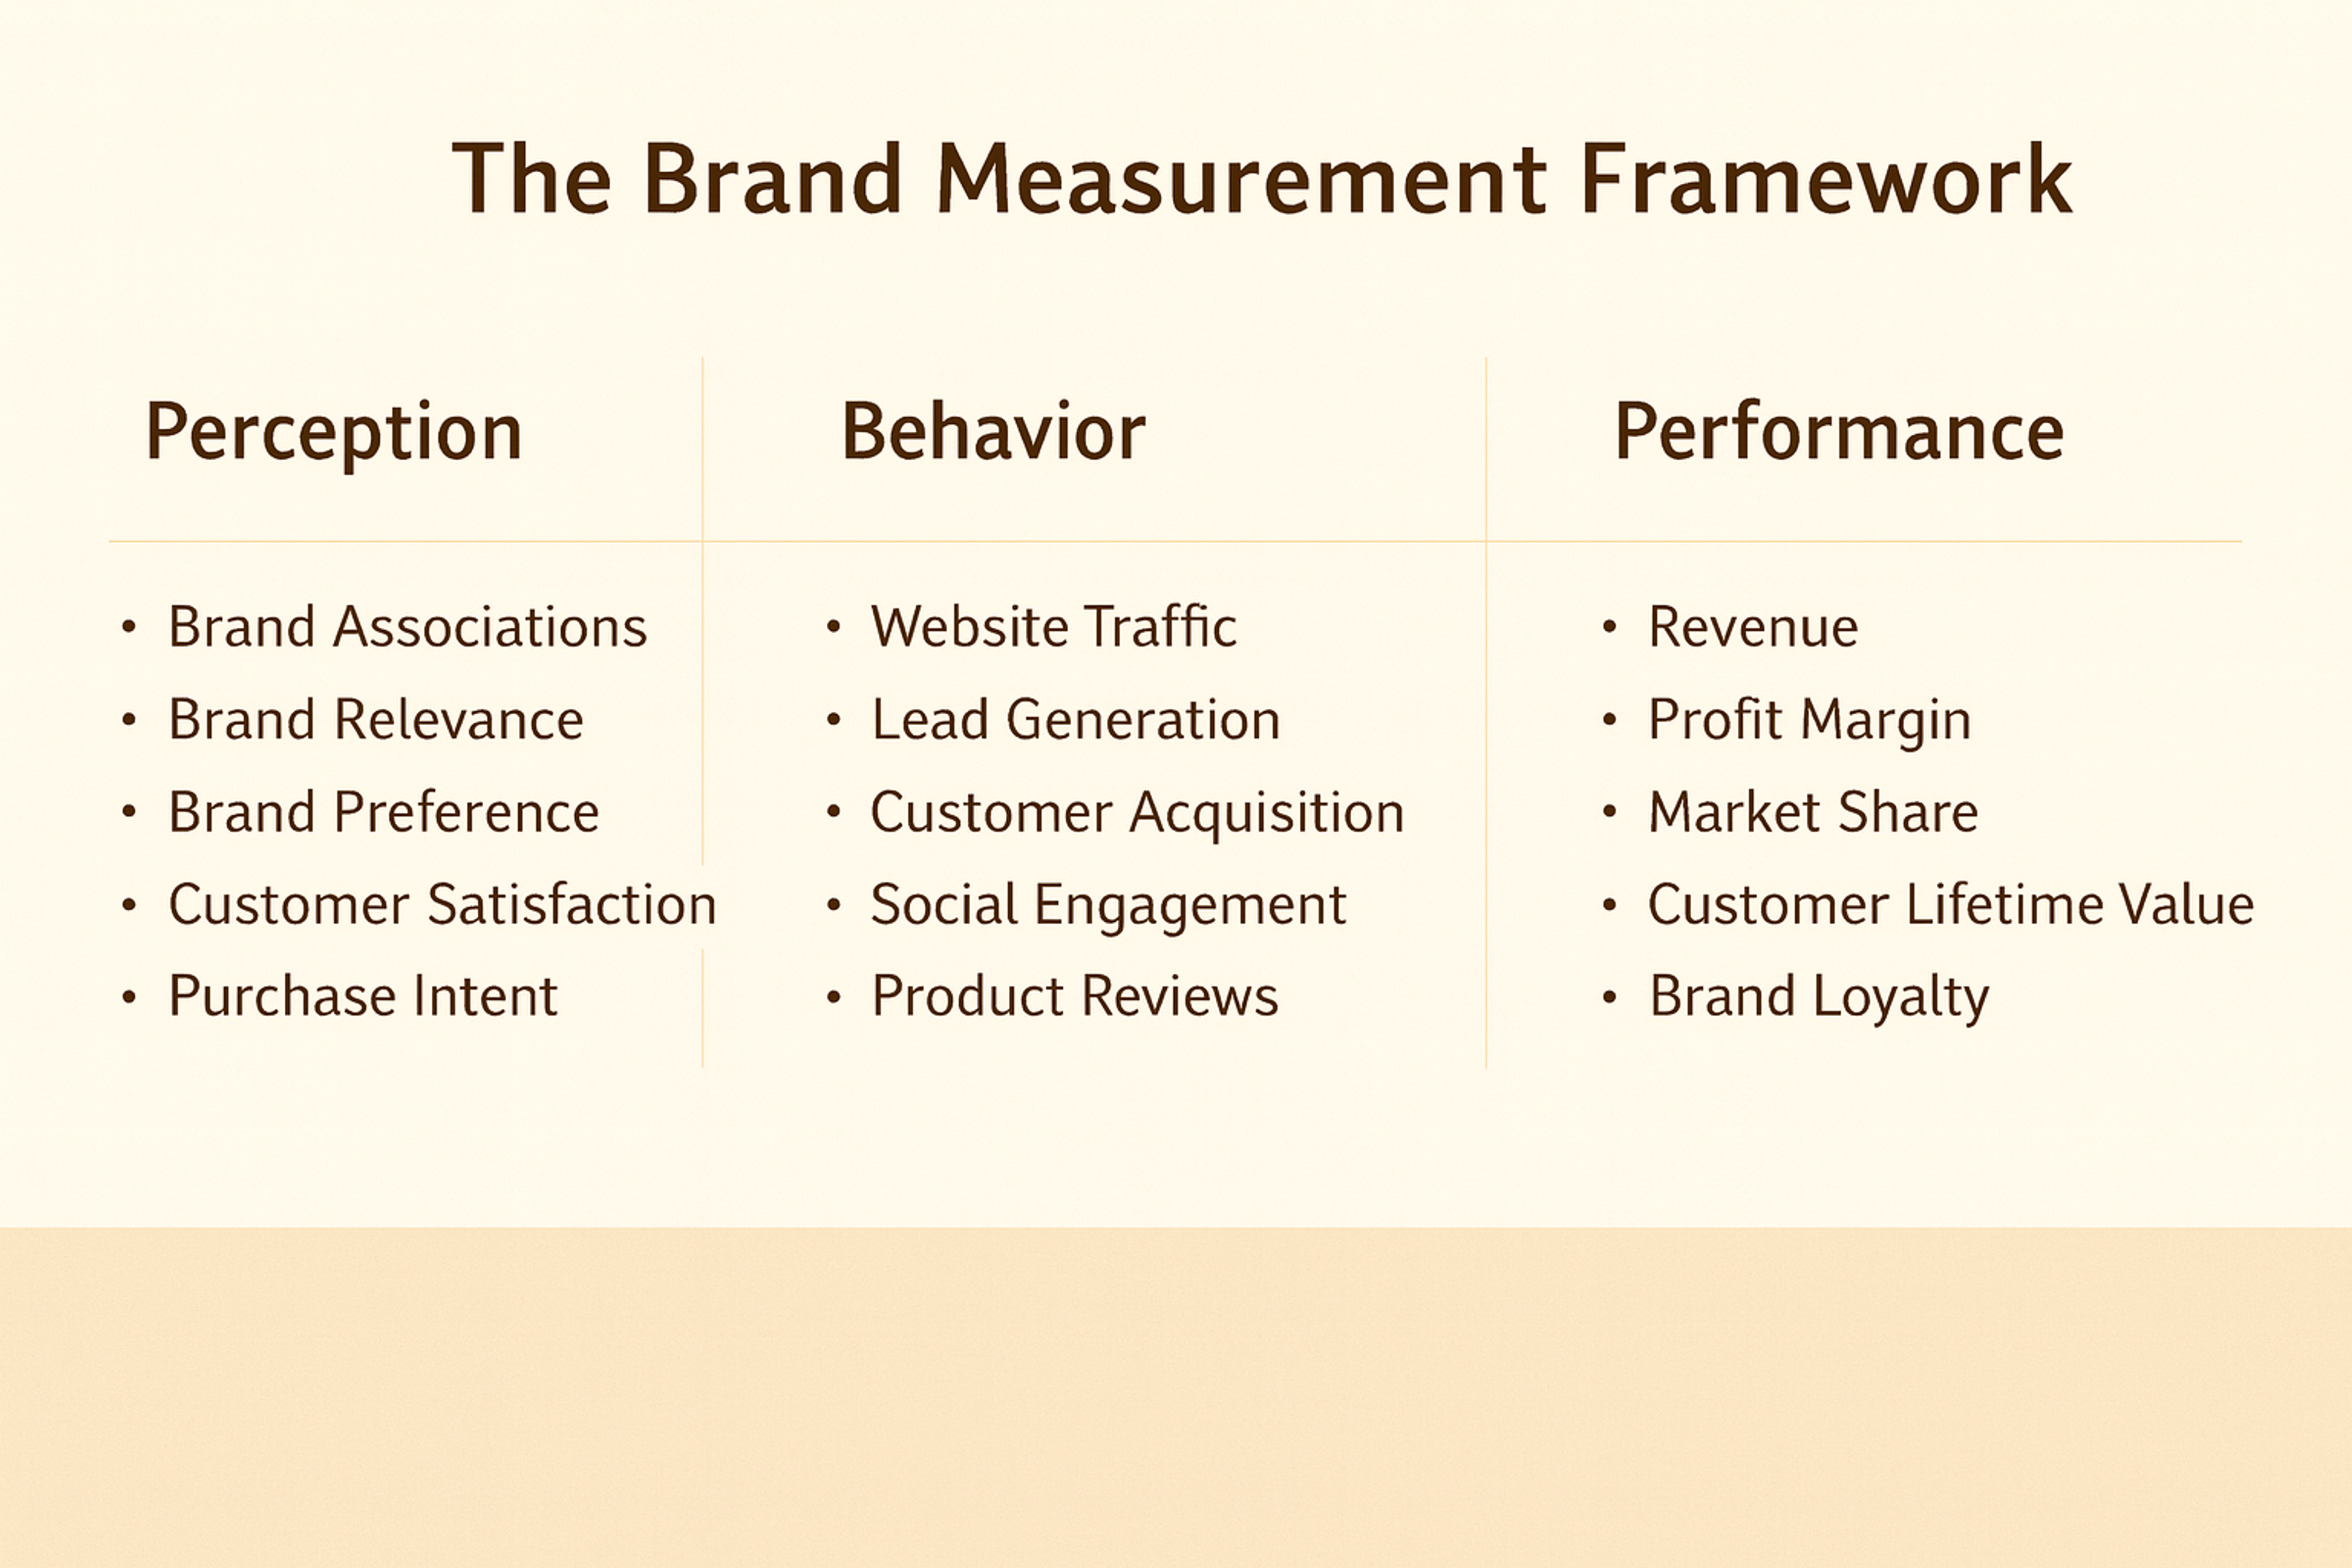
A brand analytics framework solves this problem. It connects your brand strategy, your data, and your decisions in a clear system. As a data analytics framework, it provides a structured approach to answering critical business questions about brand performance and its impact on key business outcomes.
Instead of random dashboards, you answer one simple question: Is our brand doing its job for the business? When the framework works, leaders ask sharper questions. Brand teams guide decisions with evidence instead of defending budgets.
Here's how to build one that works in the real world through a systematic process.
Start With Brand and Business Strategy
You cannot measure a brand in a vacuum. The framework must start with what your brand should do in the market and for the business.
A clear focus on specific objectives or areas of concentration is essential when defining your brand and business strategy.
Brand Strategy
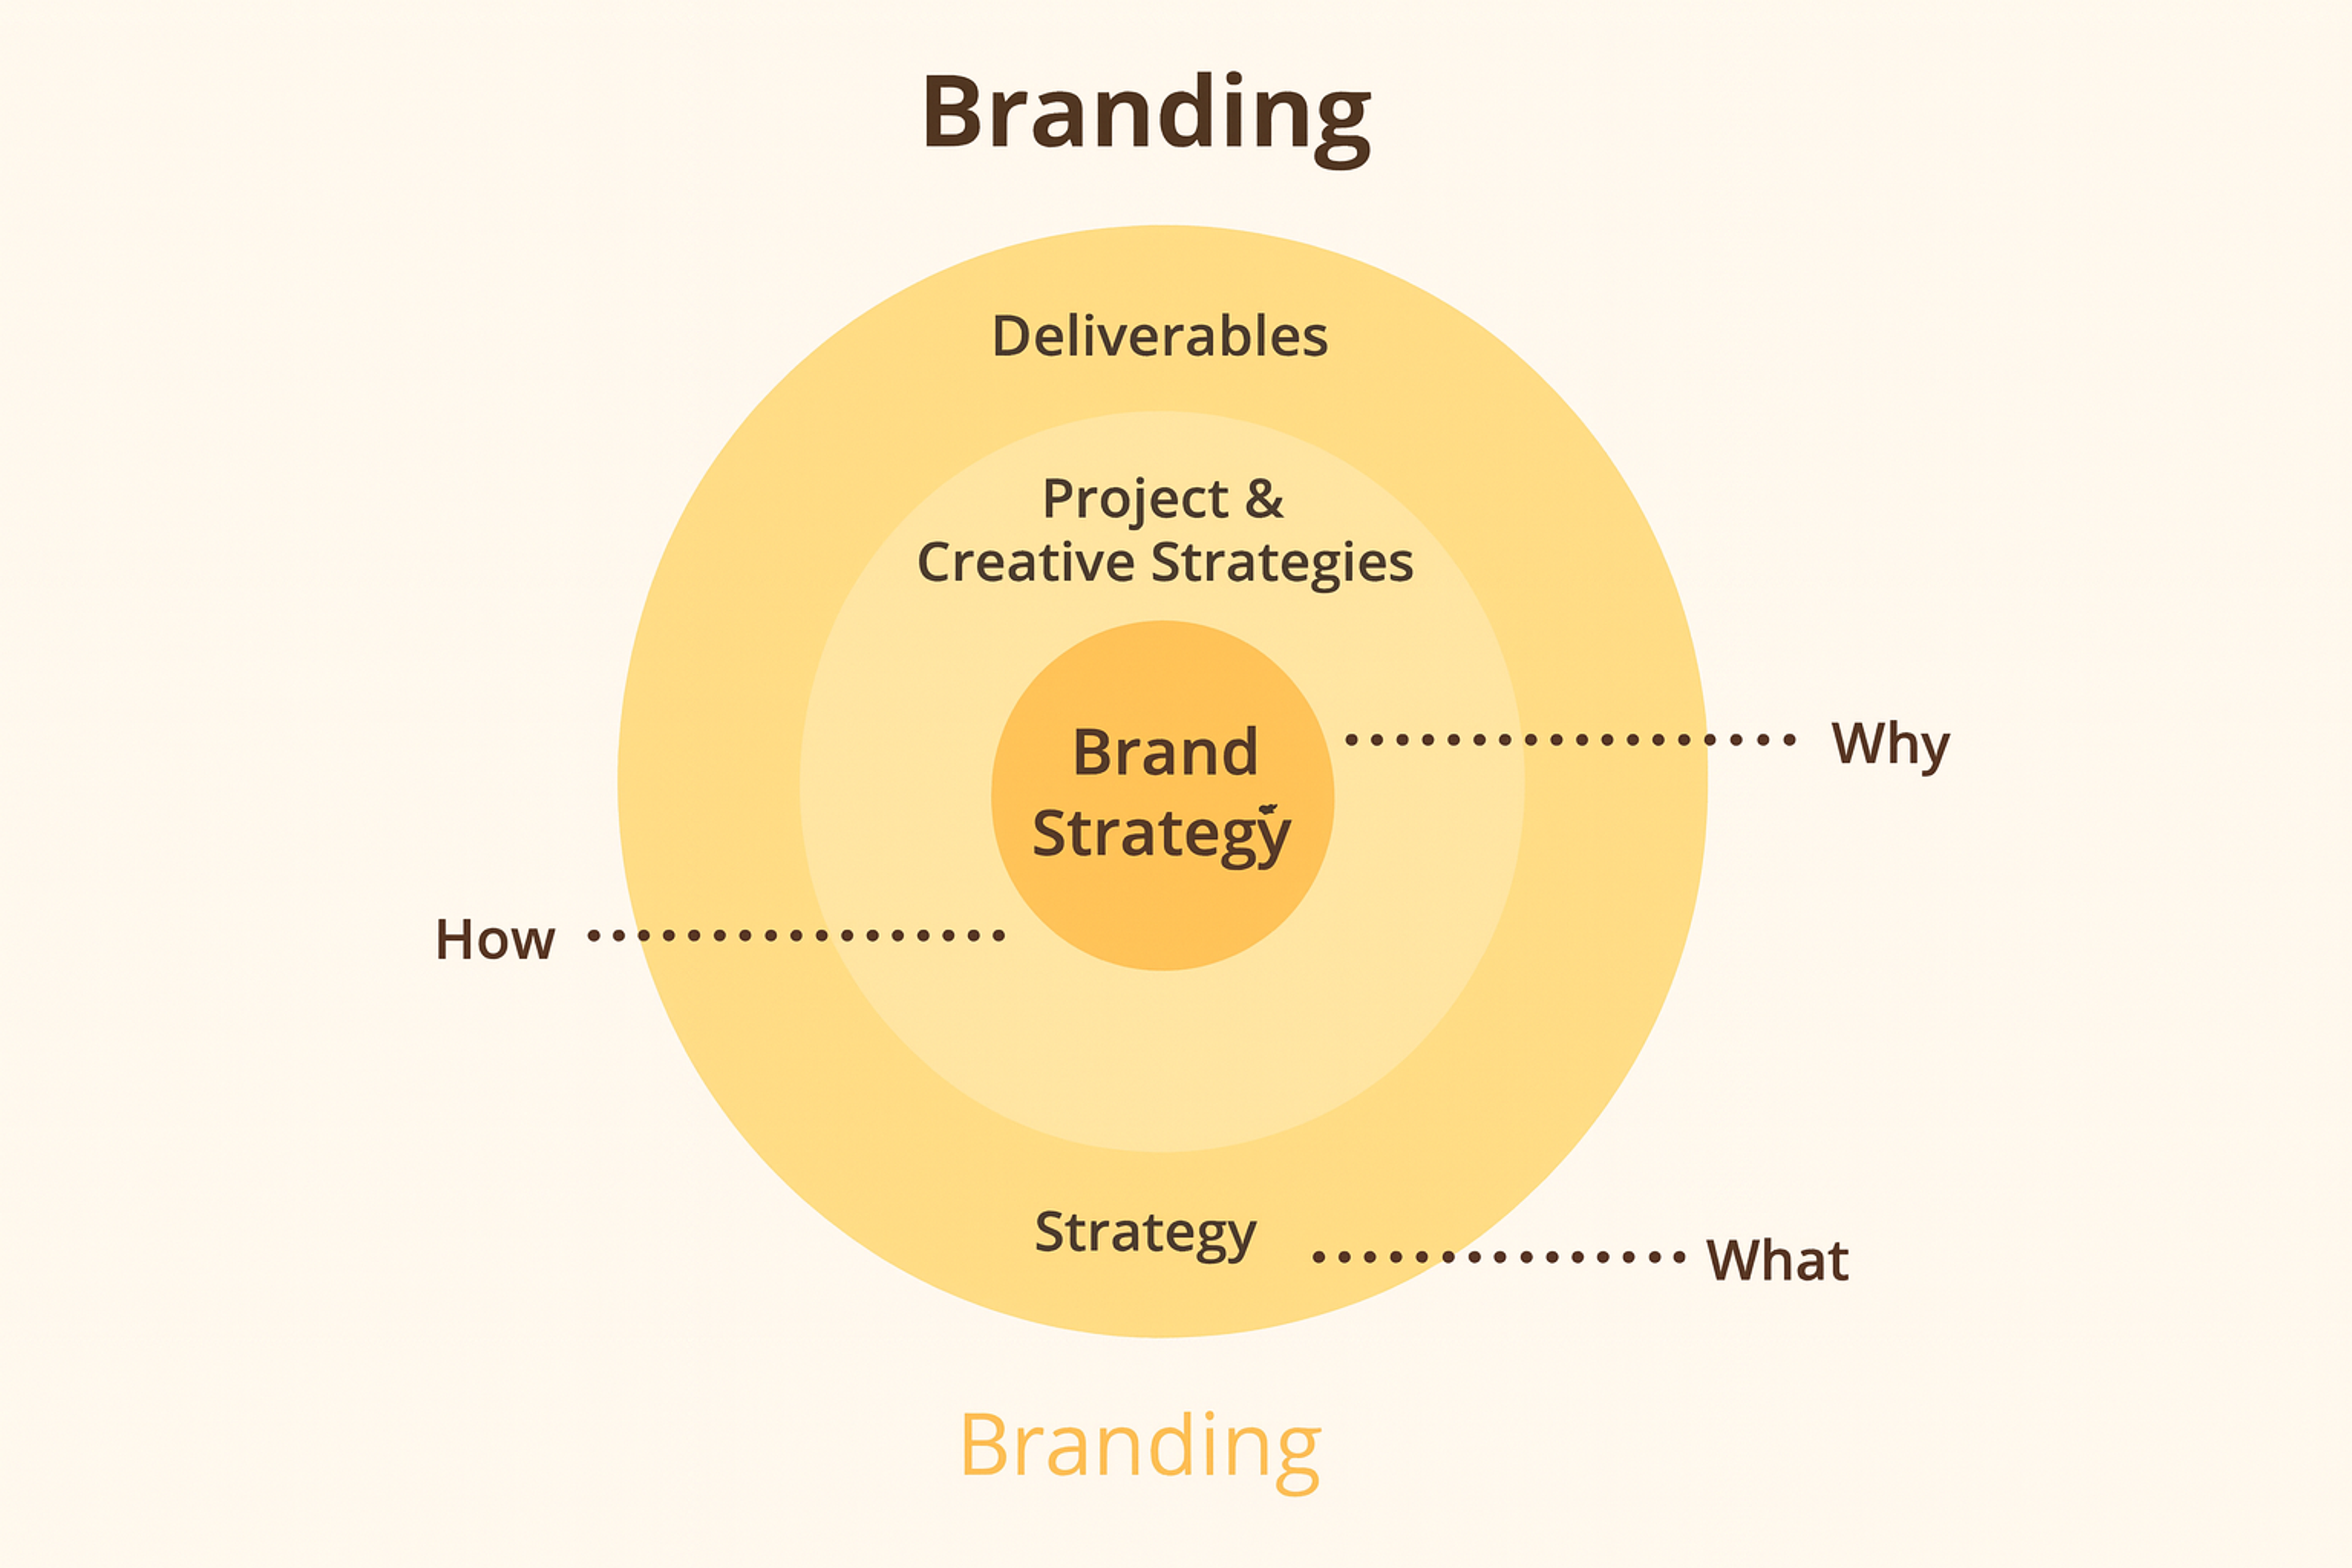
First, clarify your brand basics. What is your positioning? Who are your primary and secondary audiences? Which regions or segments matter most right now, and what is the range of areas or segments that may be relevant? What is your promise, and how is it different from competitors? You need a straightforward, shared narrative.
Your brand might defend market share against aggressive competitors, lower customer acquisition costs through recognition and trust, or improve retention by making customers feel proud to stay. CFOs need to see that brand investment produces measurable returns, not just creative awards.
Finally, translate the strategy into a few measurable objectives. Collect relevant data to measure progress toward these objectives. Increase unaided brand awareness in your core segment.
Improve perception that your brand is worth the price. Grow branded search and direct traffic in priority markets. These objectives become the backbone of your framework. Everything else hangs from them.
Translate Strategy Into Brand Questions and Metrics
Once you understand your brand and business goals, turn them into questions that analytics can answer to support informed decision-making. Are more people aware of our brand this quarter than they were last quarter? Are we winning consideration in the moments that matter? Do people see us as better, different, or just another option? When our brand metrics move, do sales follow?
Mental availability drives market share, which refers to the likelihood that a brand is recalled in purchasing situations. This makes three metrics essential: unaided awareness, share of search, and consideration rates.
Tracking them helps teams gain insights into customer behavior and market trends, enabling smarter, data-driven decisions that indicate whether the brand comes to mind when people are ready to make a purchase.
These questions help you build a measurement hierarchy. Inputs are what you do:
- media spend
- сampaigns
- partnerships
- social content.
Brand outcomes refer to the changes in people's minds, including awareness, consideration, preference, trust, perceived quality, and brand associations.
Business outcomes encompass changes in behavior and financial metrics, including trials, repeat purchases, average order value, customer retention, referrals, revenue, and margin.
Your framework should track all three levels, but brand metrics sit in the middle. They connect what you do to what you earn.
To avoid a metric zoo, pick a small set that matters most. When selecting these core metrics, include what CFOs care about, such as customer preferences, customer acquisition cost, and lifetime value. Customer acquisition cost should decrease as brand awareness improves.
Lifetime value increases with brand loyalty and retention. Your core metrics might include:
- unaided and aided awareness
- share of search for branded and category terms
- consideration and preference scores
- key brand attributes such as trustworthy or great value
- branded organic traffic and direct visits
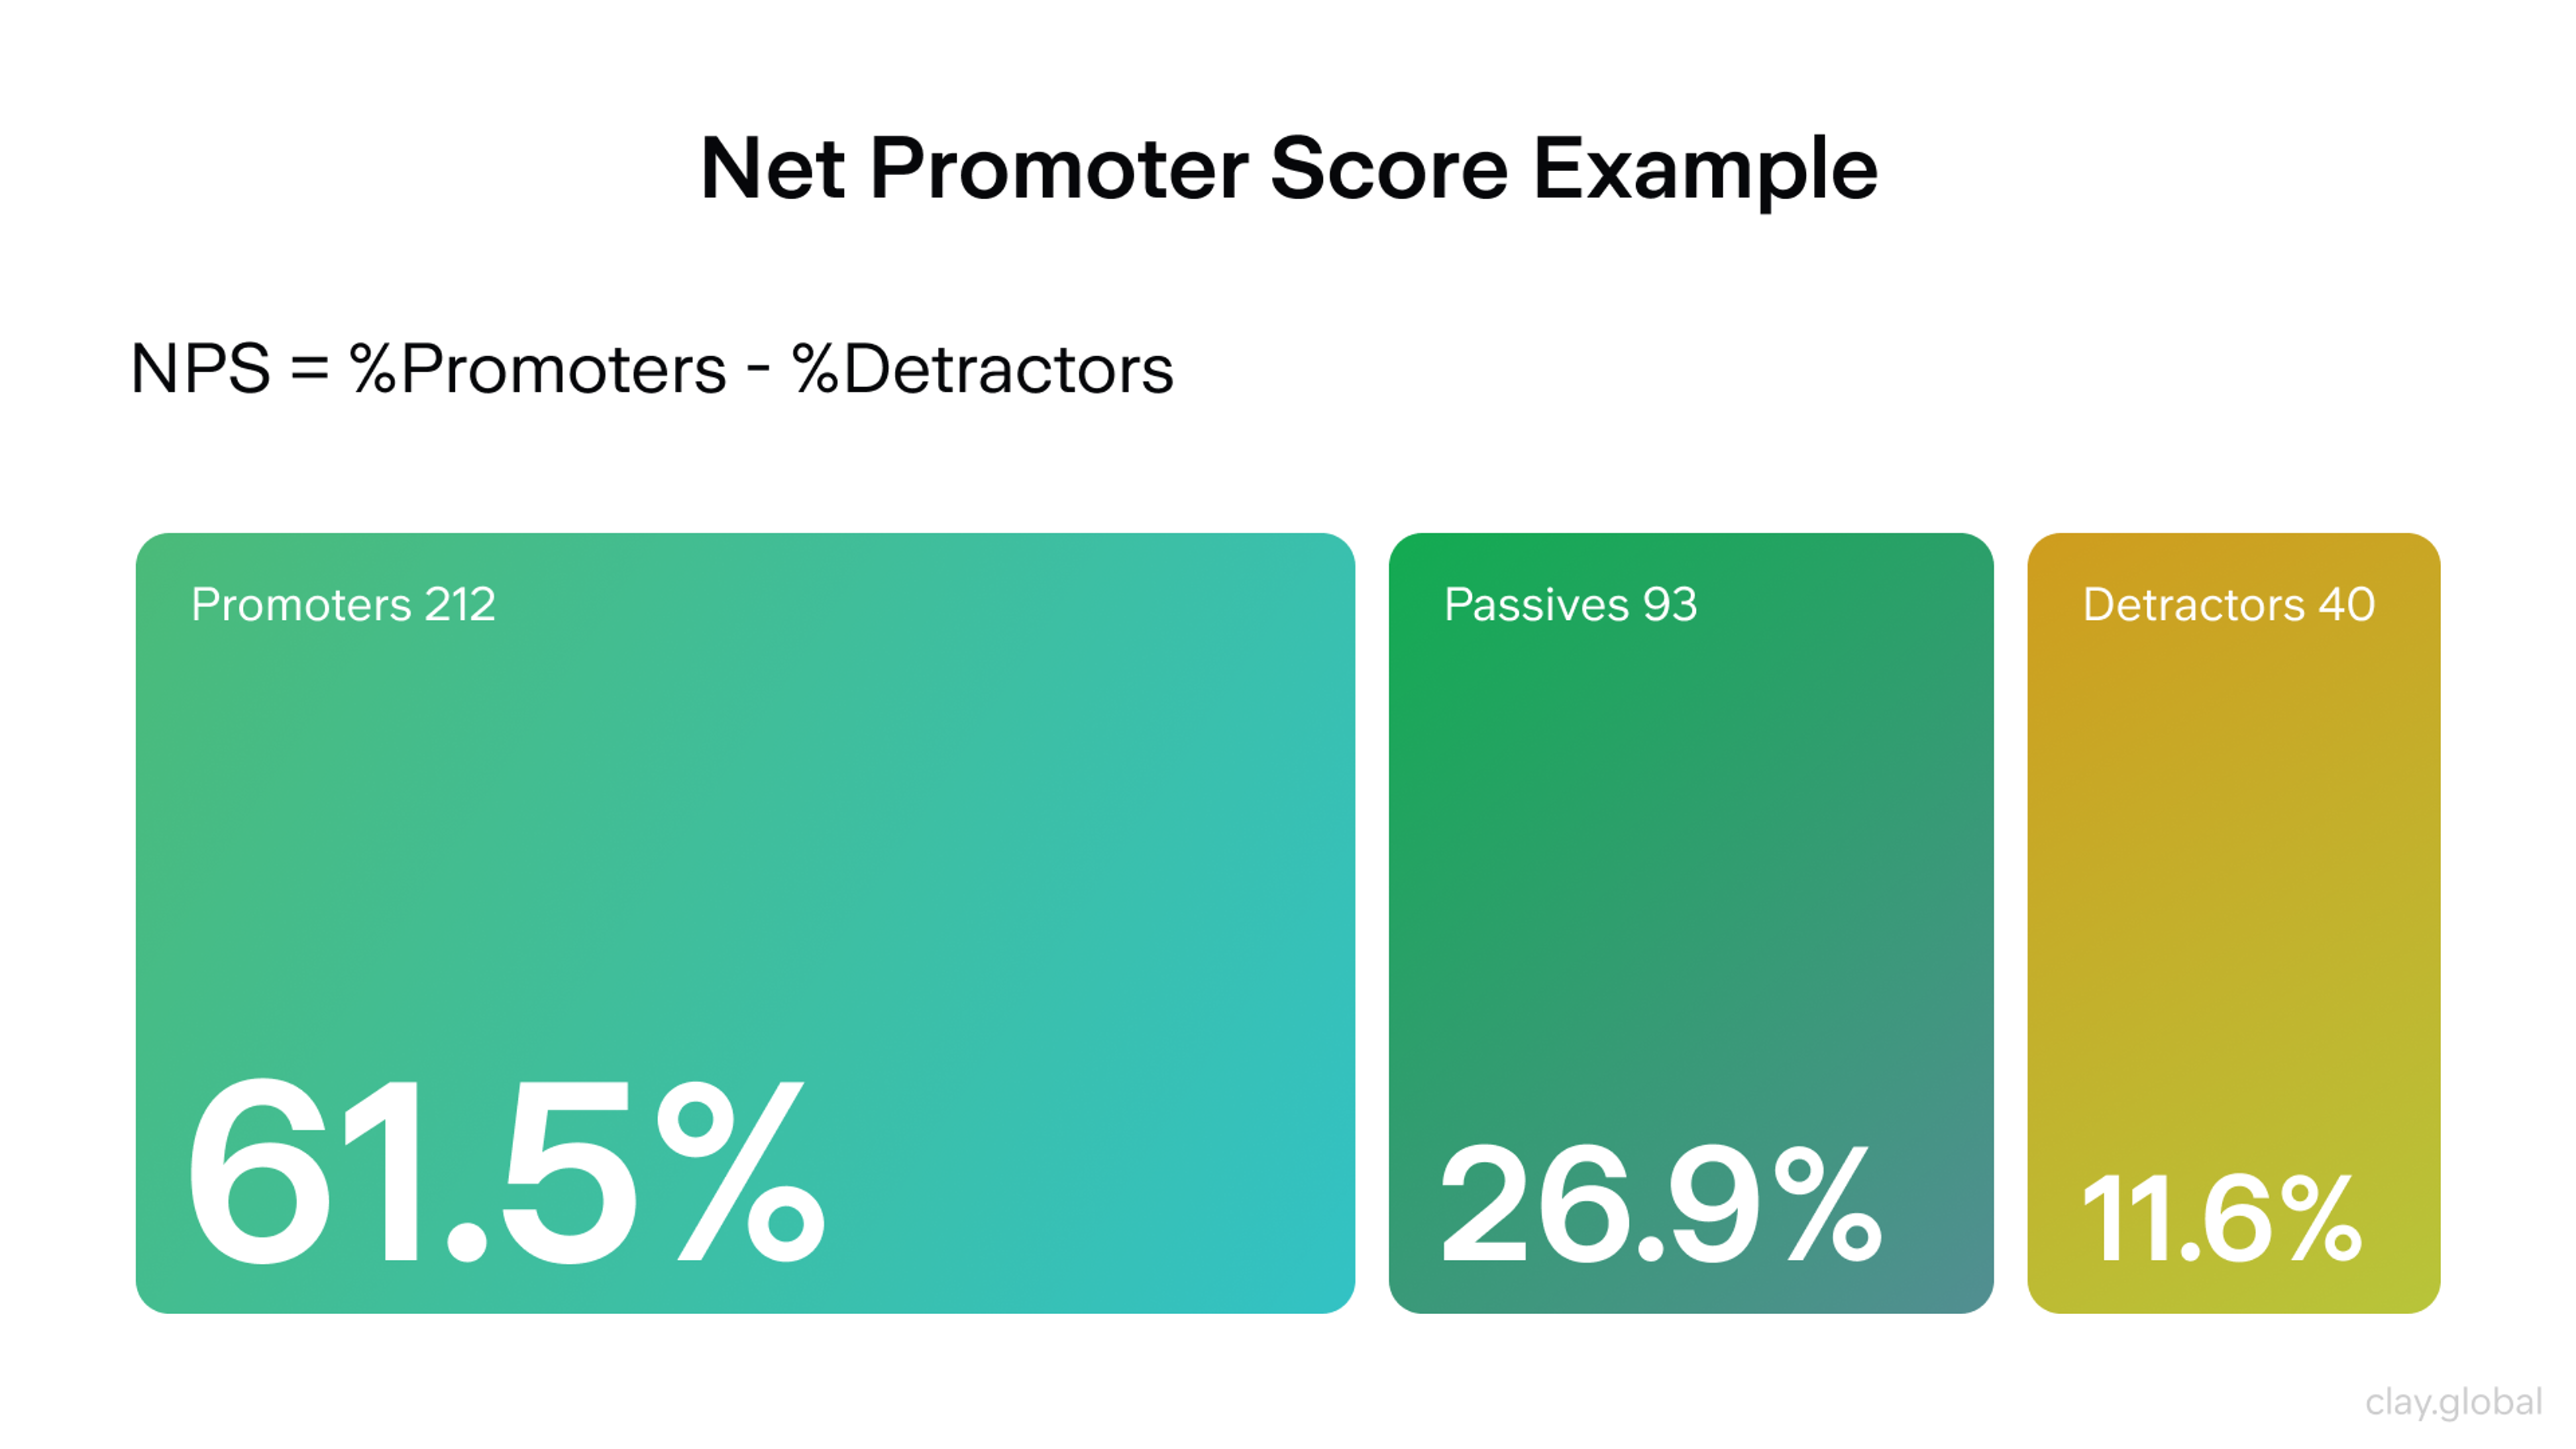
- a measure of advocacy, like the Net Promoter Score.
Selecting these core metrics enables informed decisions that drive business growth and success.
Net Promoter Score (NPS)
You can keep secondary metrics, but your core ones should fit comfortably on a single page.
Map Your Data Sources and Signals
Next, understand where your signals will come from. A brand lives in people's minds but leaves traces in their data. Effective data collection is crucial to ensure comprehensive data coverage from all relevant sources.
Start with digital and customer relationship management data. You need a clear structure and reliable inputs so your analysis is trustworthy.
From digital and CRM sources, focus on:
- Web and analytics platforms (e.g., Google Analytics): direct traffic, branded search volume, time on site, and conversion paths by source. These behavioral signals help validate survey-based awareness metrics.
- Search Console: share of search and the split between branded and generic queries.
- Social and content platforms: reach, engagement, mentions, and sentiment, including both structured and unstructured data.
- Customer database and CRM: open rates, click rates, churn, and win-back performance.
- Paid media platforms: impressions, reach, frequency, viewability, and, when available, brand lift studies.
Then add offline and more complex business data. Track sales by region, channel, and product line. Include retail audits and distribution. Note call center topics and complaint categories. Monitor public relations coverage for volume, tone, and prominence.
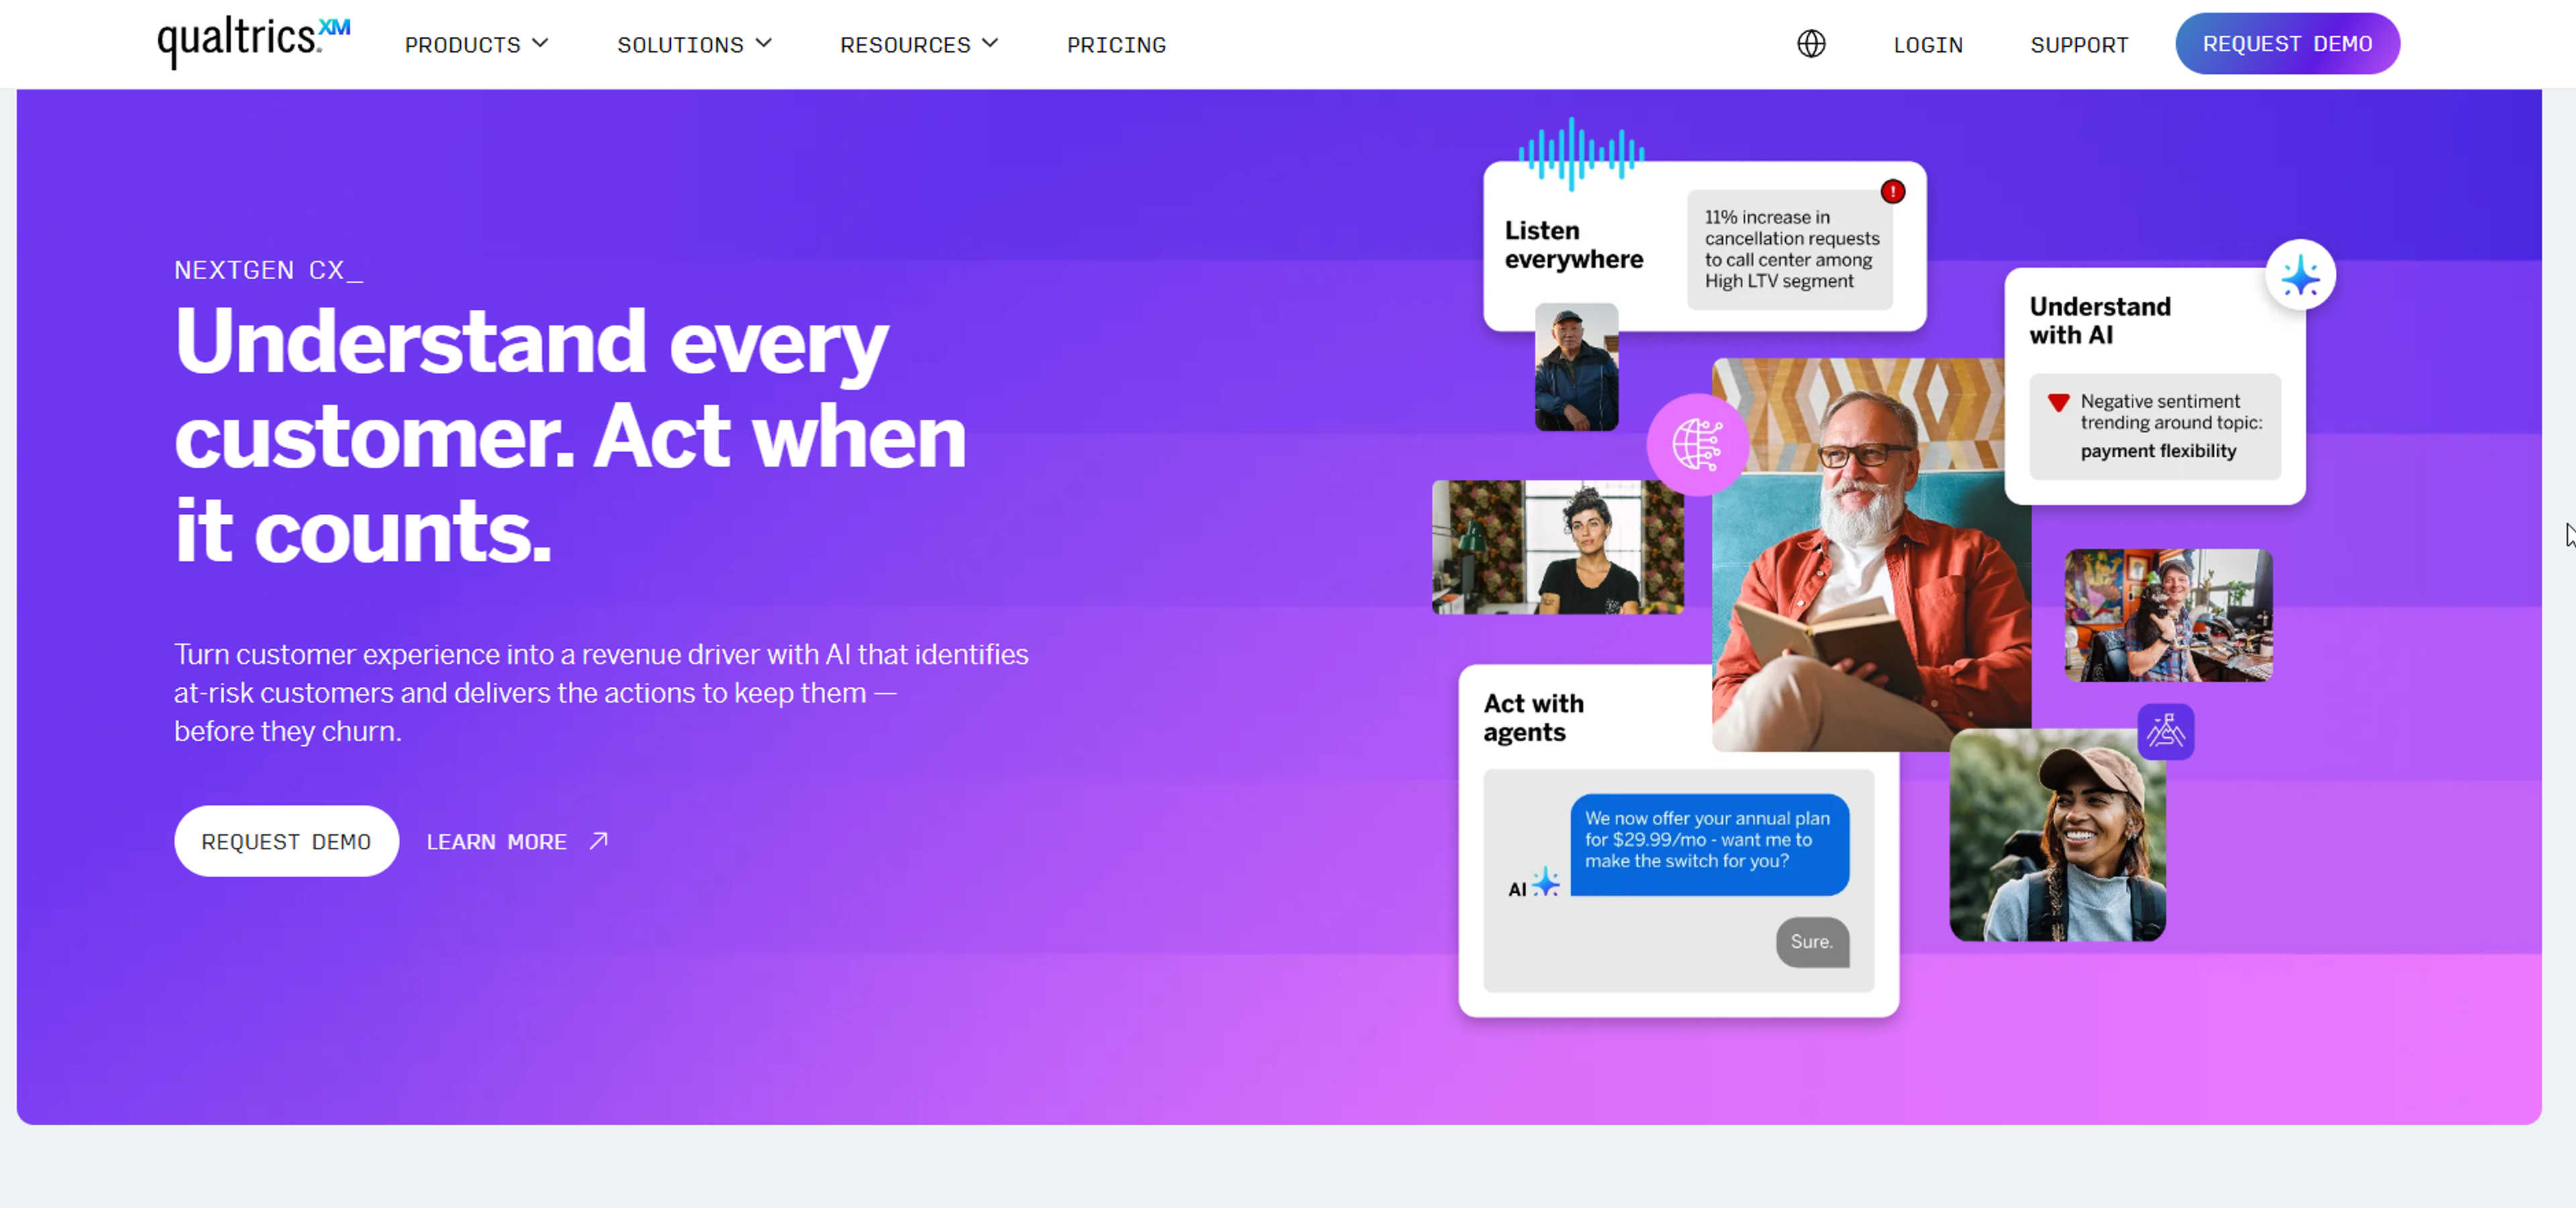
Finally, include research inputs. Brand tracking surveys, run through tools like Qualtrics, measure aided and unaided awareness every quarter. Ad testing and brand lift studies provide campaign-specific insights, while panels or community feedback round out the picture.
Source: qualtrics.com
You do not need perfect coverage from day one. What matters is knowing which signals are fast but noisy, such as social engagement, and which are slower but more robust, like quarterly brand tracking. Over time, your framework will combine both types.
Design the Brand Measurement Model
Now design the logic of your framework: how the brand is intended to function. A simple way to start is with a brand funnel: awareness leads to consideration, which in turn leads to preference, followed by usage, and ultimately, advocacy. Throughout this process, data analysis helps track market trends and understand the customer journey at each stage.
Each step of the funnel can be measured with a mix of survey data and behavioral data:
- Awareness: unaided and aided survey results, plus search volume for your brand.
- Consideration: survey questions about which brands people would consider, and click share between branded and generic searches.
- Preference: first-choice brand status, share of search, and key feature terms that are closely tied to your brand.
- Usage: penetration, repeat purchase, active users, and purchasing behavior over time.
- Advocacy: Net Promoter Score (NPS), review scores, referral rates, and repeat purchases as indicators of loyalty and engagement.
When selecting the types of metrics to track, make sure you cover three core views of brand performance: overall brand performance, unique vs repeat customers, and market basket analysis that highlights the top products and products purchased together. This helps uncover cross-selling opportunities and deeper insights into what is being bought and by whom.
Brand Measurement Framework
This explains why brand metrics, such as awareness and consideration, are leading indicators: they move before revenue. Sales and margin are lagging indicators that react later. Your framework should show both on different time scales so stakeholders can connect early brand shifts with later financial outcomes.
Finally, connect brand equity to revenue. You do not need a complex econometric model on day one. Start simple and track how shifts in brand metrics correlate with changes in acquisition cost, conversion rates, or retention.
You can:
- Run experiments where some markets receive more brand-heavy investment and others receive less, while keeping performance marketing relatively stable.
- Use these tests to estimate how much value the brand creates beyond short-term clicks.
While econometric marketing mix modeling provides precision, this kind of framework delivers faster insights with less statistical complexity. Attribution models track the conversion path effectively, while brand analytics measures the mental availability that precedes search and creates demand.
The goal is not to prove that the brand caused an exact percentage of revenue. The goal is to demonstrate a clear and consistent relationship between brand health and business health. For example, you might track how awareness shifts correlate with a meaningful reduction in customer acquisition costs over six to twelve months.
Standardize Definitions, Taxonomies, and Tracking
Even the best model fails if the data feeding it is messy. That is why a solid brand analytics framework always includes essential yet often overlooked elements.
Establish Naming Conventions
- Ensure every campaign, creative, and asset follows a consistent naming pattern.
- Apply the same structure across all channels (television, social, search, influencer, out-of-home, etc.).
- Consistent names allow activities to be grouped, analyzed, and connected back to brand objectives.
Define Tracking Standards
- Set clear parameters for all digital campaigns.
- Configure pixels and event tracking for website and app behavior.
- Create offline tracking codes for promotional or printed campaigns.
- Standardize classification rules for mentions and sentiment in social listening tools.
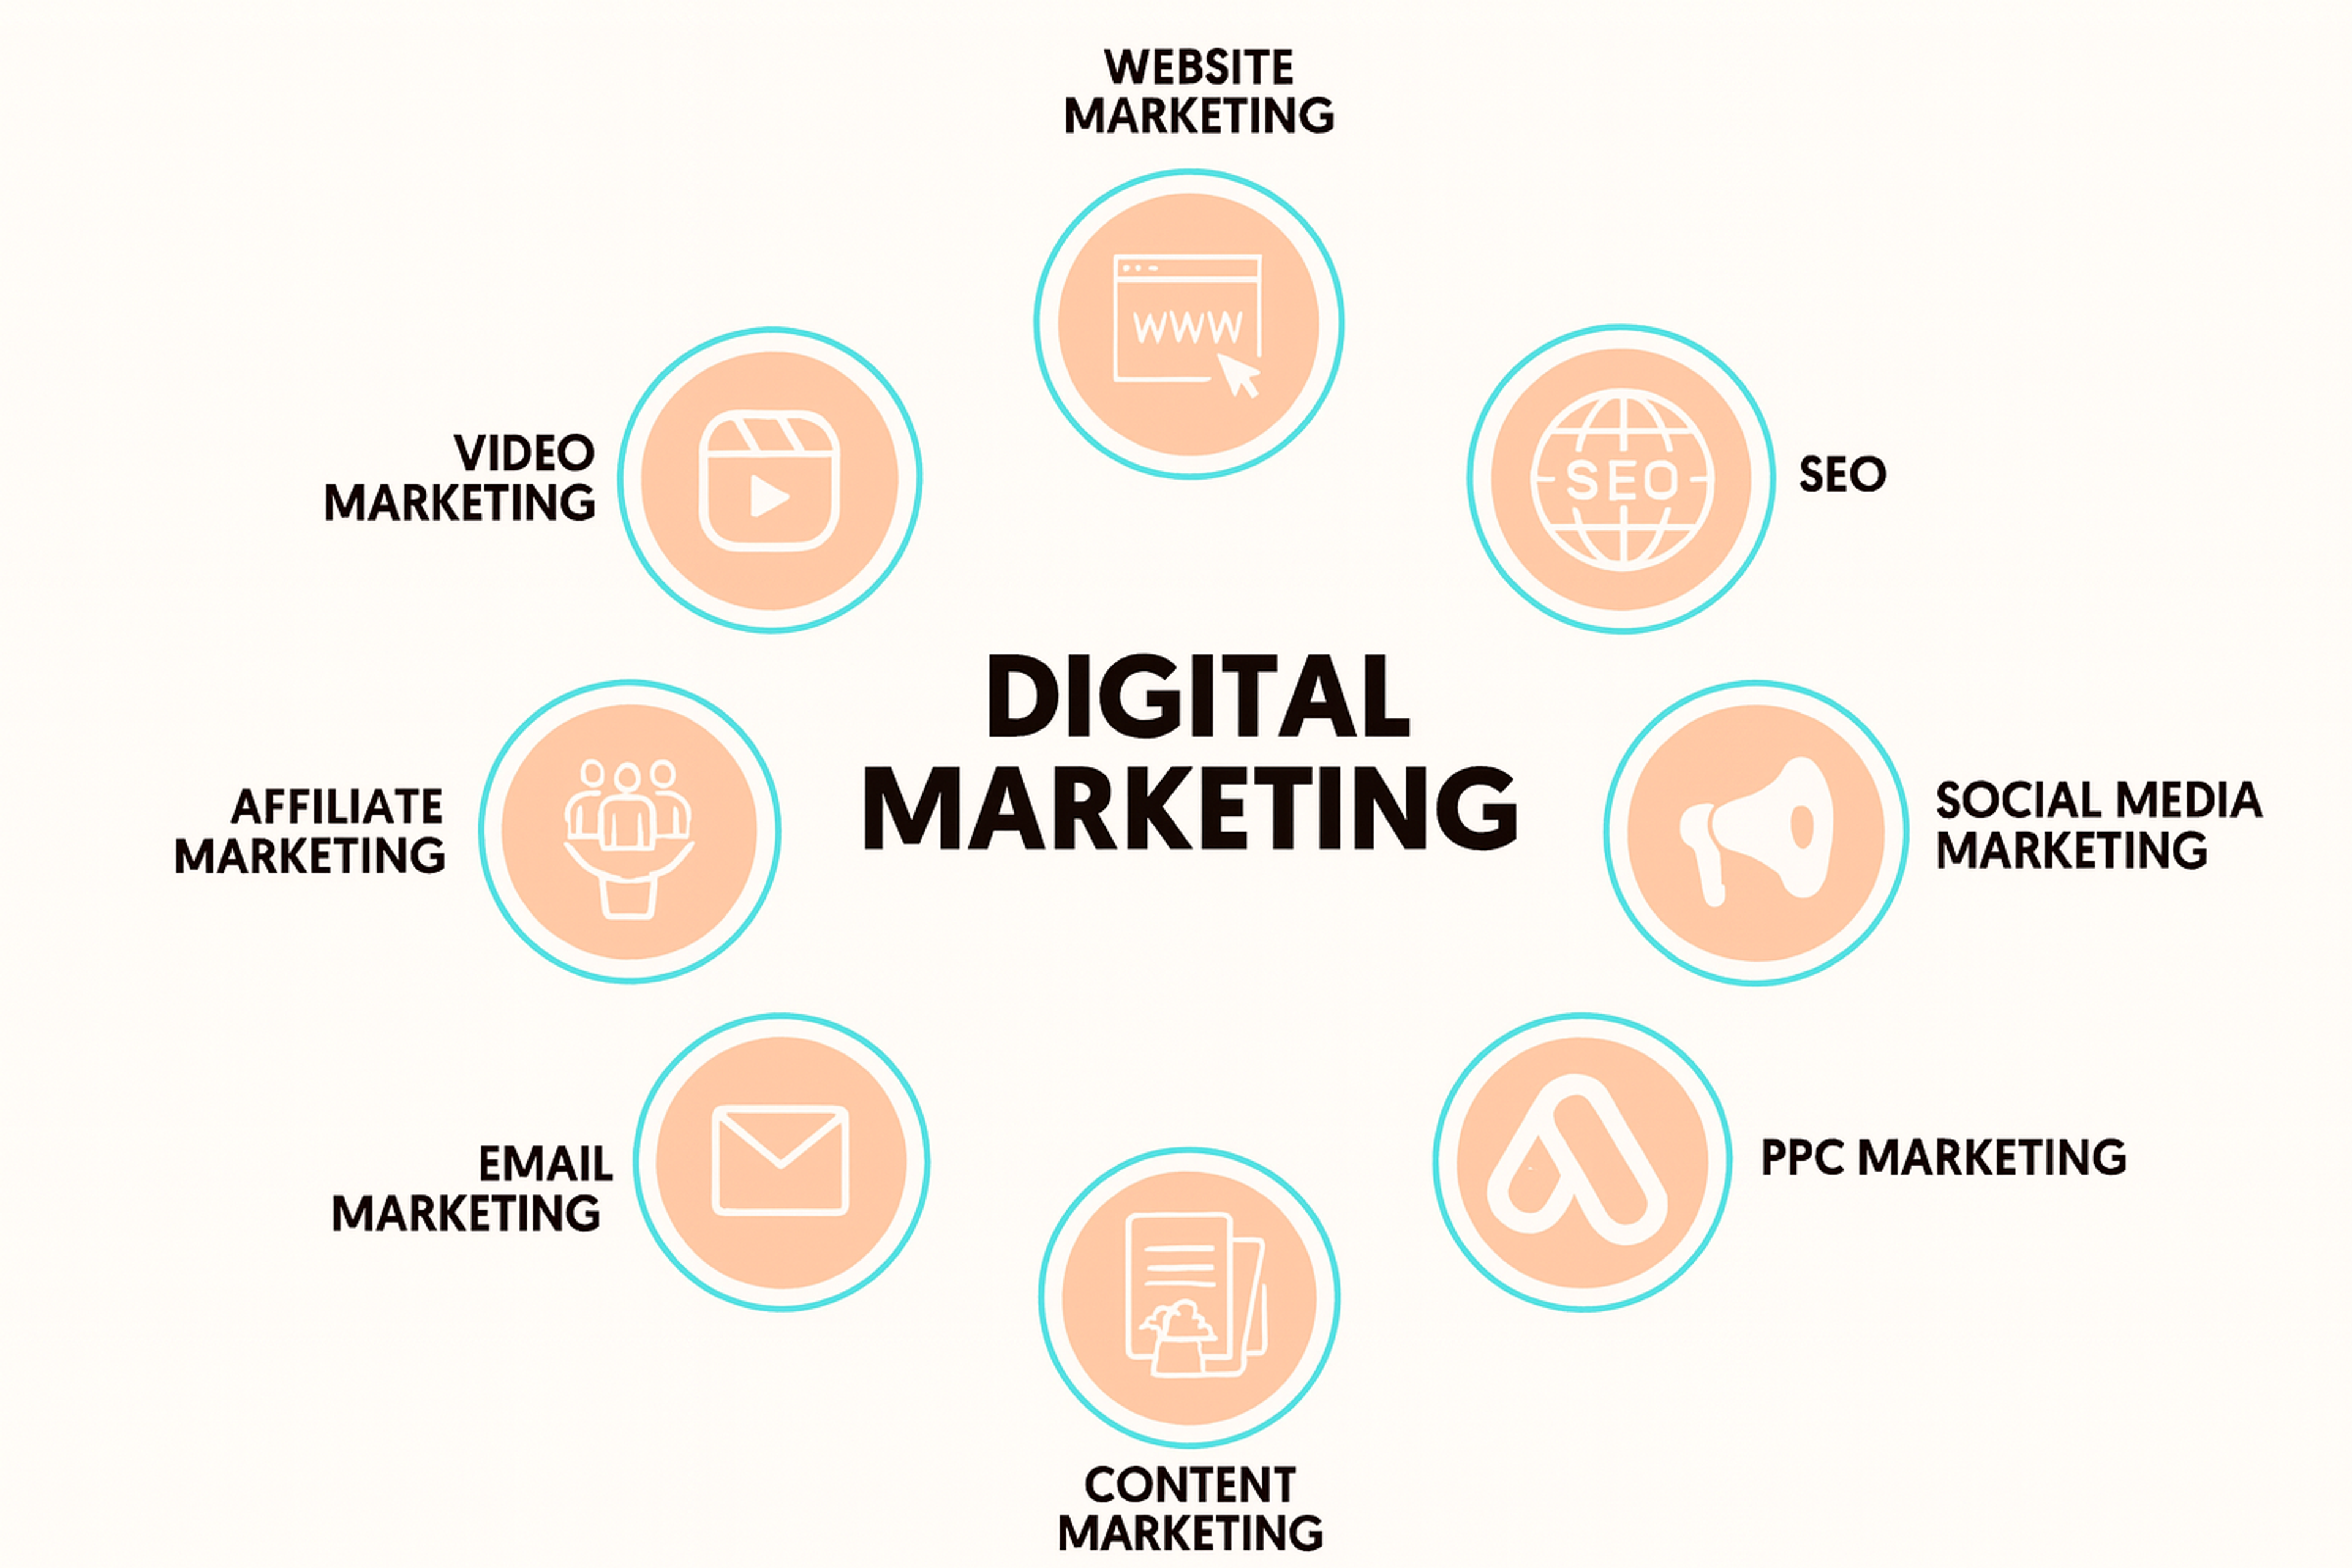
Digital Marketing
Document Key Metrics and Definitions
- Clearly define what each core metric represents.
- Specify how composite metrics are calculated (e.g., a brand awareness index may combine unaided awareness, aided awareness, and share of search).
- Share and centralize this documentation: tribal knowledge does not scale.
Finally, set governance. Who owns the taxonomy? Who can create new tags or campaign types? Who ensures surveys are consistent over time? Involve domain experts to validate and refine taxonomies and tracking standards, ensuring accuracy and alignment with industry best practices. Without clear owners, your framework will slowly break as campaigns launch and teams change.
Build Decision-Centric Dashboards and Reports
Once your logic and data are in place, build the visible components of the framework: dashboards and reports. Dashboards should support decisions, not just display data. This is where many teams fail by trying to show everything at once and overwhelming the viewer.
The key is to design for different roles instead of one generic view:
- Executives (especially CFOs) need simple dashboards that show brand health trends alongside financial outcomes. They want a stable summary: is brand health moving up or down, are there early warning signals, and are brand investments pulling their weight?
- Brand managers need more detail: which markets, segments, and campaigns are driving brand metrics, and where the brand is gaining or losing ground.
- Analysts and data scientists need full depth: raw data, breakdowns, and the ability to run ad-hoc analyses. They can use AI and advanced models to uncover new patterns that drive better decisions.
A good brand dashboard follows a story. Start with top-line brand health using a few key metrics over time with clear targets. Then break down the drivers by markets, segments, and channels that contribute most to changes.
Add activity context, such as major campaigns, product launches, PR events, or external shocks, that may explain movements in the metrics. Finally, show actions and experiments: what the team did last time and what is planned next.
Tools like Tableau or Looker help visualize patterns quickly and effectively. Simple line charts, bar charts, and funnels are usually enough. The goal is clarity and focus, not impressive graphics for their own sake.
Create a Ritual Around Brand Analytics
A framework is not just dashboards. It is a way of working. If nobody examines the data, or if they examine it but never act, nothing changes.
Create regular rituals around brand analytics. Businesses and companies use these rituals to make strategic decisions and drive sales by leveraging insights from data. Weekly sessions provide a quick pulse on leading indicators, including search, social, web, and campaign performance. This is more about checking for anomalies than declaring victory.
Monthly reviews go deeper into brand metrics, campaign results, and key initiatives. Identify what is working, what is not, and what needs testing.
Quarterly reviews are strategic, combining brand metrics, business results, and research. Decide where to double down, what to stop, and what to launch next.
Each session should end with clear actions: experiments to run, hypotheses to test, investment shifts to make, and briefs to update. Over time, this rhythm leads to more informed decisions and improved marketing strategies, teaching the organization that brand analytics is not homework. It is a tool for making better choices.
Test, Learn, and Evolve the Framework
No framework is perfect from day one. Brand, markets, and channels evolve, and your analytics must evolve with them. Evolving your data analytics framework helps businesses gain a competitive edge in ecommerce by identifying potential customers and showcasing other products while optimizing for the right keywords.
Start with a minimum viable framework:
- a small set of metrics
- a clear brand funnel
- a simple dashboard that connects brand outcomes to business outcomes in at least one or two core markets
Use this as a pilot.
Run experiments. Test various creative approaches and track their impact on brand perceptions. Run geo-split or audience-split tests where some groups see more brand-led communication.
Split Testing
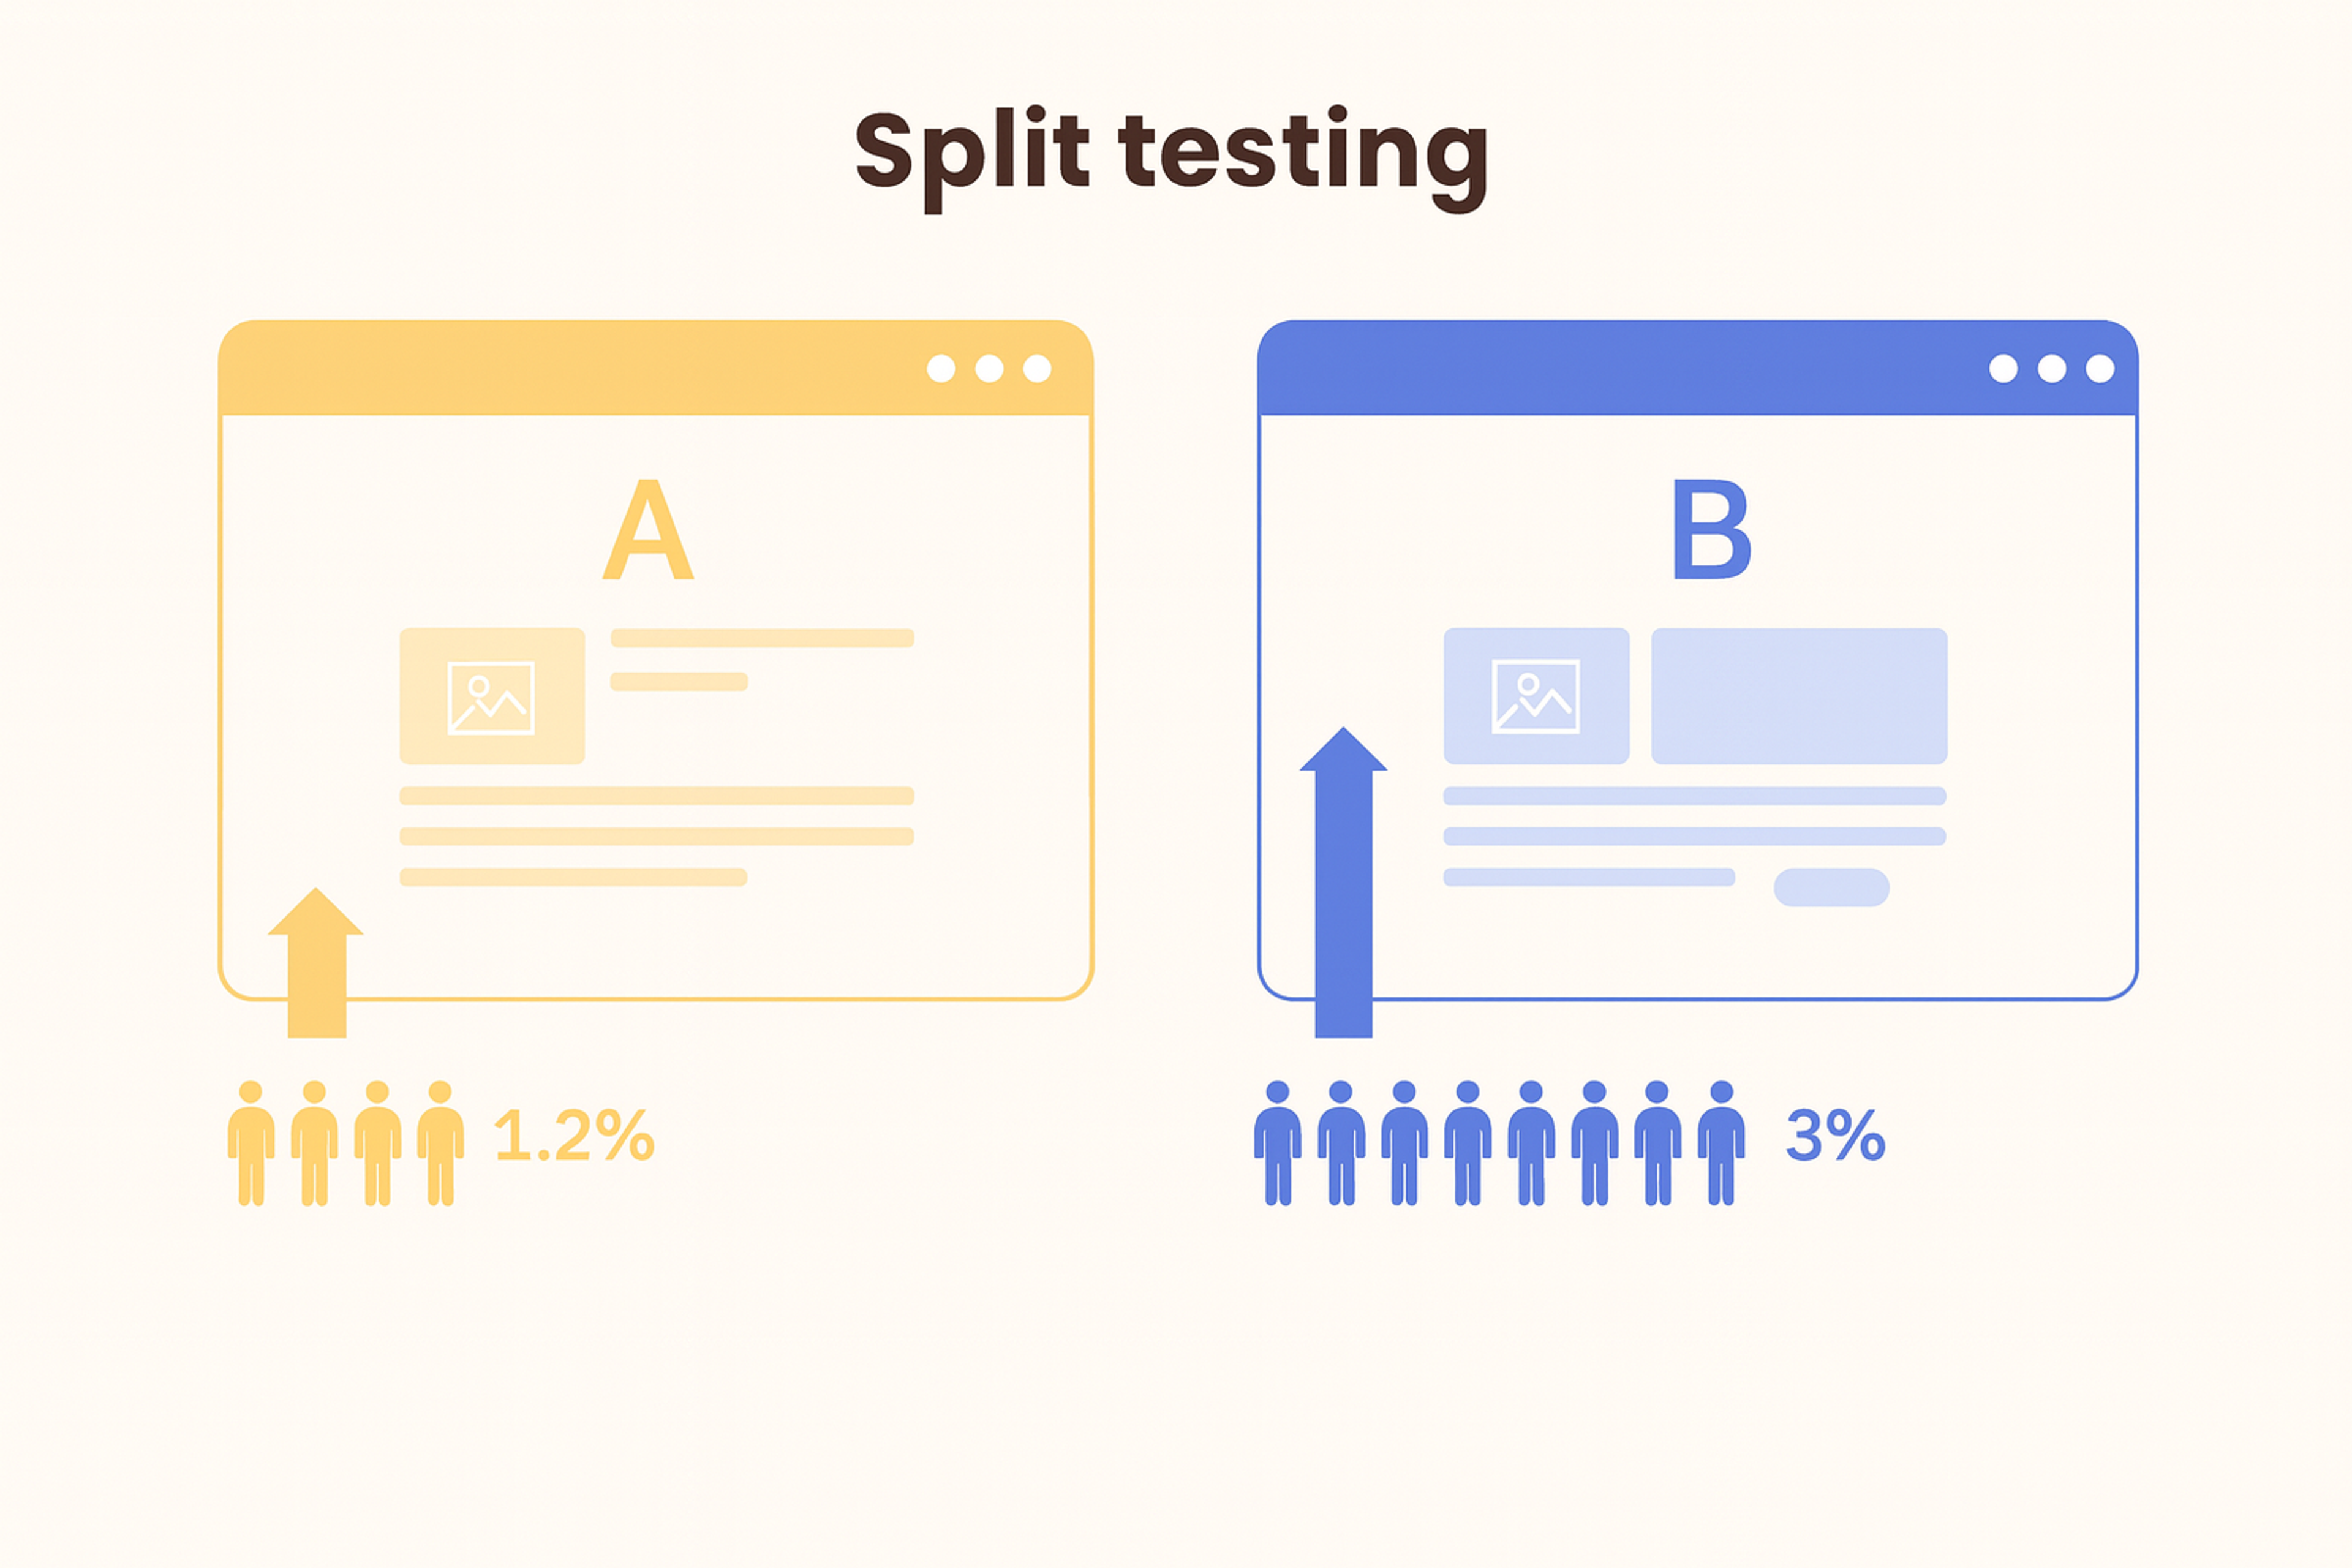
Use these tests to refine your model. Specific favorite metrics are not actually predictive of business results. You may discover that the share of search is a stronger leading indicator than what you previously tracked. That is normal. Prune metrics that do not provide value, and add more effective ones.
You will know your framework is maturing when teams stop asking for new metrics all the time and instead ask for clearer connections between the existing ones.
FAQ
What Is Brand Analytics?
Brand analytics measures how audiences perceive, engage with, and respond to a brand. It tracks awareness, sentiment, share of voice, and conversions across digital and offline channels to guide brand growth decisions.
What Is Brand Analytics On Amazon?
Amazon Brand Analytics gives sellers insights into customer search terms, product comparisons, and repeat purchase behavior. To access Amazon Brand Analytics, brands must enroll in the Amazon Brand Registry, as registration with this registry is required.
This tool provides valuable data for brands that sell on Amazon, including insights into the performance of other sellers and their products. It helps brands understand what drives visibility, traffic, and loyalty within Amazon's marketplace.
What Are The 4 Types Of Analytics?
Descriptive (what happened), Diagnostic (why it happened), Predictive (what might happen), and Prescriptive (what to do next). Brand teams utilize all four to track awareness, optimize campaigns, and forecast performance, including specific search terms.
What Are The 5 C's Of Branding?
Clarity, Consistency, Credibility, Connection, and Commitment. Together, they shape how a brand communicates, delivers value, and builds long-term trust.
Read more:
Conclusion
A brand analytics framework that works is not just a clever diagram. It is a living system that links brand strategy, data, and daily decisions.
You start by grounding it in your brand and business goals. You translate those into questions, metrics, and a simple model of how a brand creates value. You build the plumbing: tracking, taxonomies, and consistent data.
You create dashboards that tell a clear story for each audience. And you build rituals where the team regularly uses that story to decide what to do next.
That is how a fundamental brand analytics framework begins, not with a perfect model, but with a better decision today.

About Clay
Clay is a UI/UX design & branding agency in San Francisco. We team up with startups and leading brands to create transformative digital experience. Clients: Facebook, Slack, Google, Amazon, Credit Karma, Zenefits, etc.
Learn moreAbout Clay
Clay is a UI/UX design & branding agency in San Francisco. We team up with startups and leading brands to create transformative digital experience. Clients: Facebook, Slack, Google, Amazon, Credit Karma, Zenefits, etc.
Learn more