UX design decisions used to rely heavily on intuition. Today, that approach no longer holds up. In 2026, the most effective digital products are shaped by a continuous flow of behavioral data, user feedback, and real-world performance signals.
Data-driven design is not about replacing creativity. It is about grounding creative decisions in evidence, so every interface, interaction, and feature aligns with how people actually think and behave.
When done well, it reduces guesswork, improves conversions, and creates experiences that feel intuitive from the first interaction.
Key Takeaways
- Data-driven design combines user research, behavioral analytics, and experimentation to guide UX decisions
- It helps teams reduce risk by validating ideas before scaling them
- The best teams balance quantitative data with qualitative insights
- AI and real-time analytics have made data more accessible, but interpretation still requires human judgment
- Strong data-driven design improves usability, engagement, and conversion across the entire product lifecycle
What Is Data-Driven Design?
Data-driven design is the practice of using measurable insights to inform design decisions instead of relying solely on assumptions or opinions.
At its core, it answers a simple question: What are users actually doing, and how can we design better experiences based on that behavior?
This includes:
- User feedback, including interviews, surveys, and usability testing
- Performance metrics, like conversion rates, retention, and task success
In 2026, this definition has expanded. Data-driven design now also includes AI-generated insights, predictive analytics, and real-time user signals that dynamically adapt interfaces.
The shift is clear. Design is no longer static. It is continuously informed by live data.
Data-Driven Design
Why Data-Driven UX Matters More Than Ever
Digital products have become more complex, and user expectations are higher than ever. People expect seamless, personalized, and fast experiences across devices.
At the same time, discovery has changed. Users now interact with products through search engines, AI assistants, and conversational interfaces. This means UX decisions influence not only usability but also visibility.
Data-driven design helps teams respond to this complexity in three critical ways.
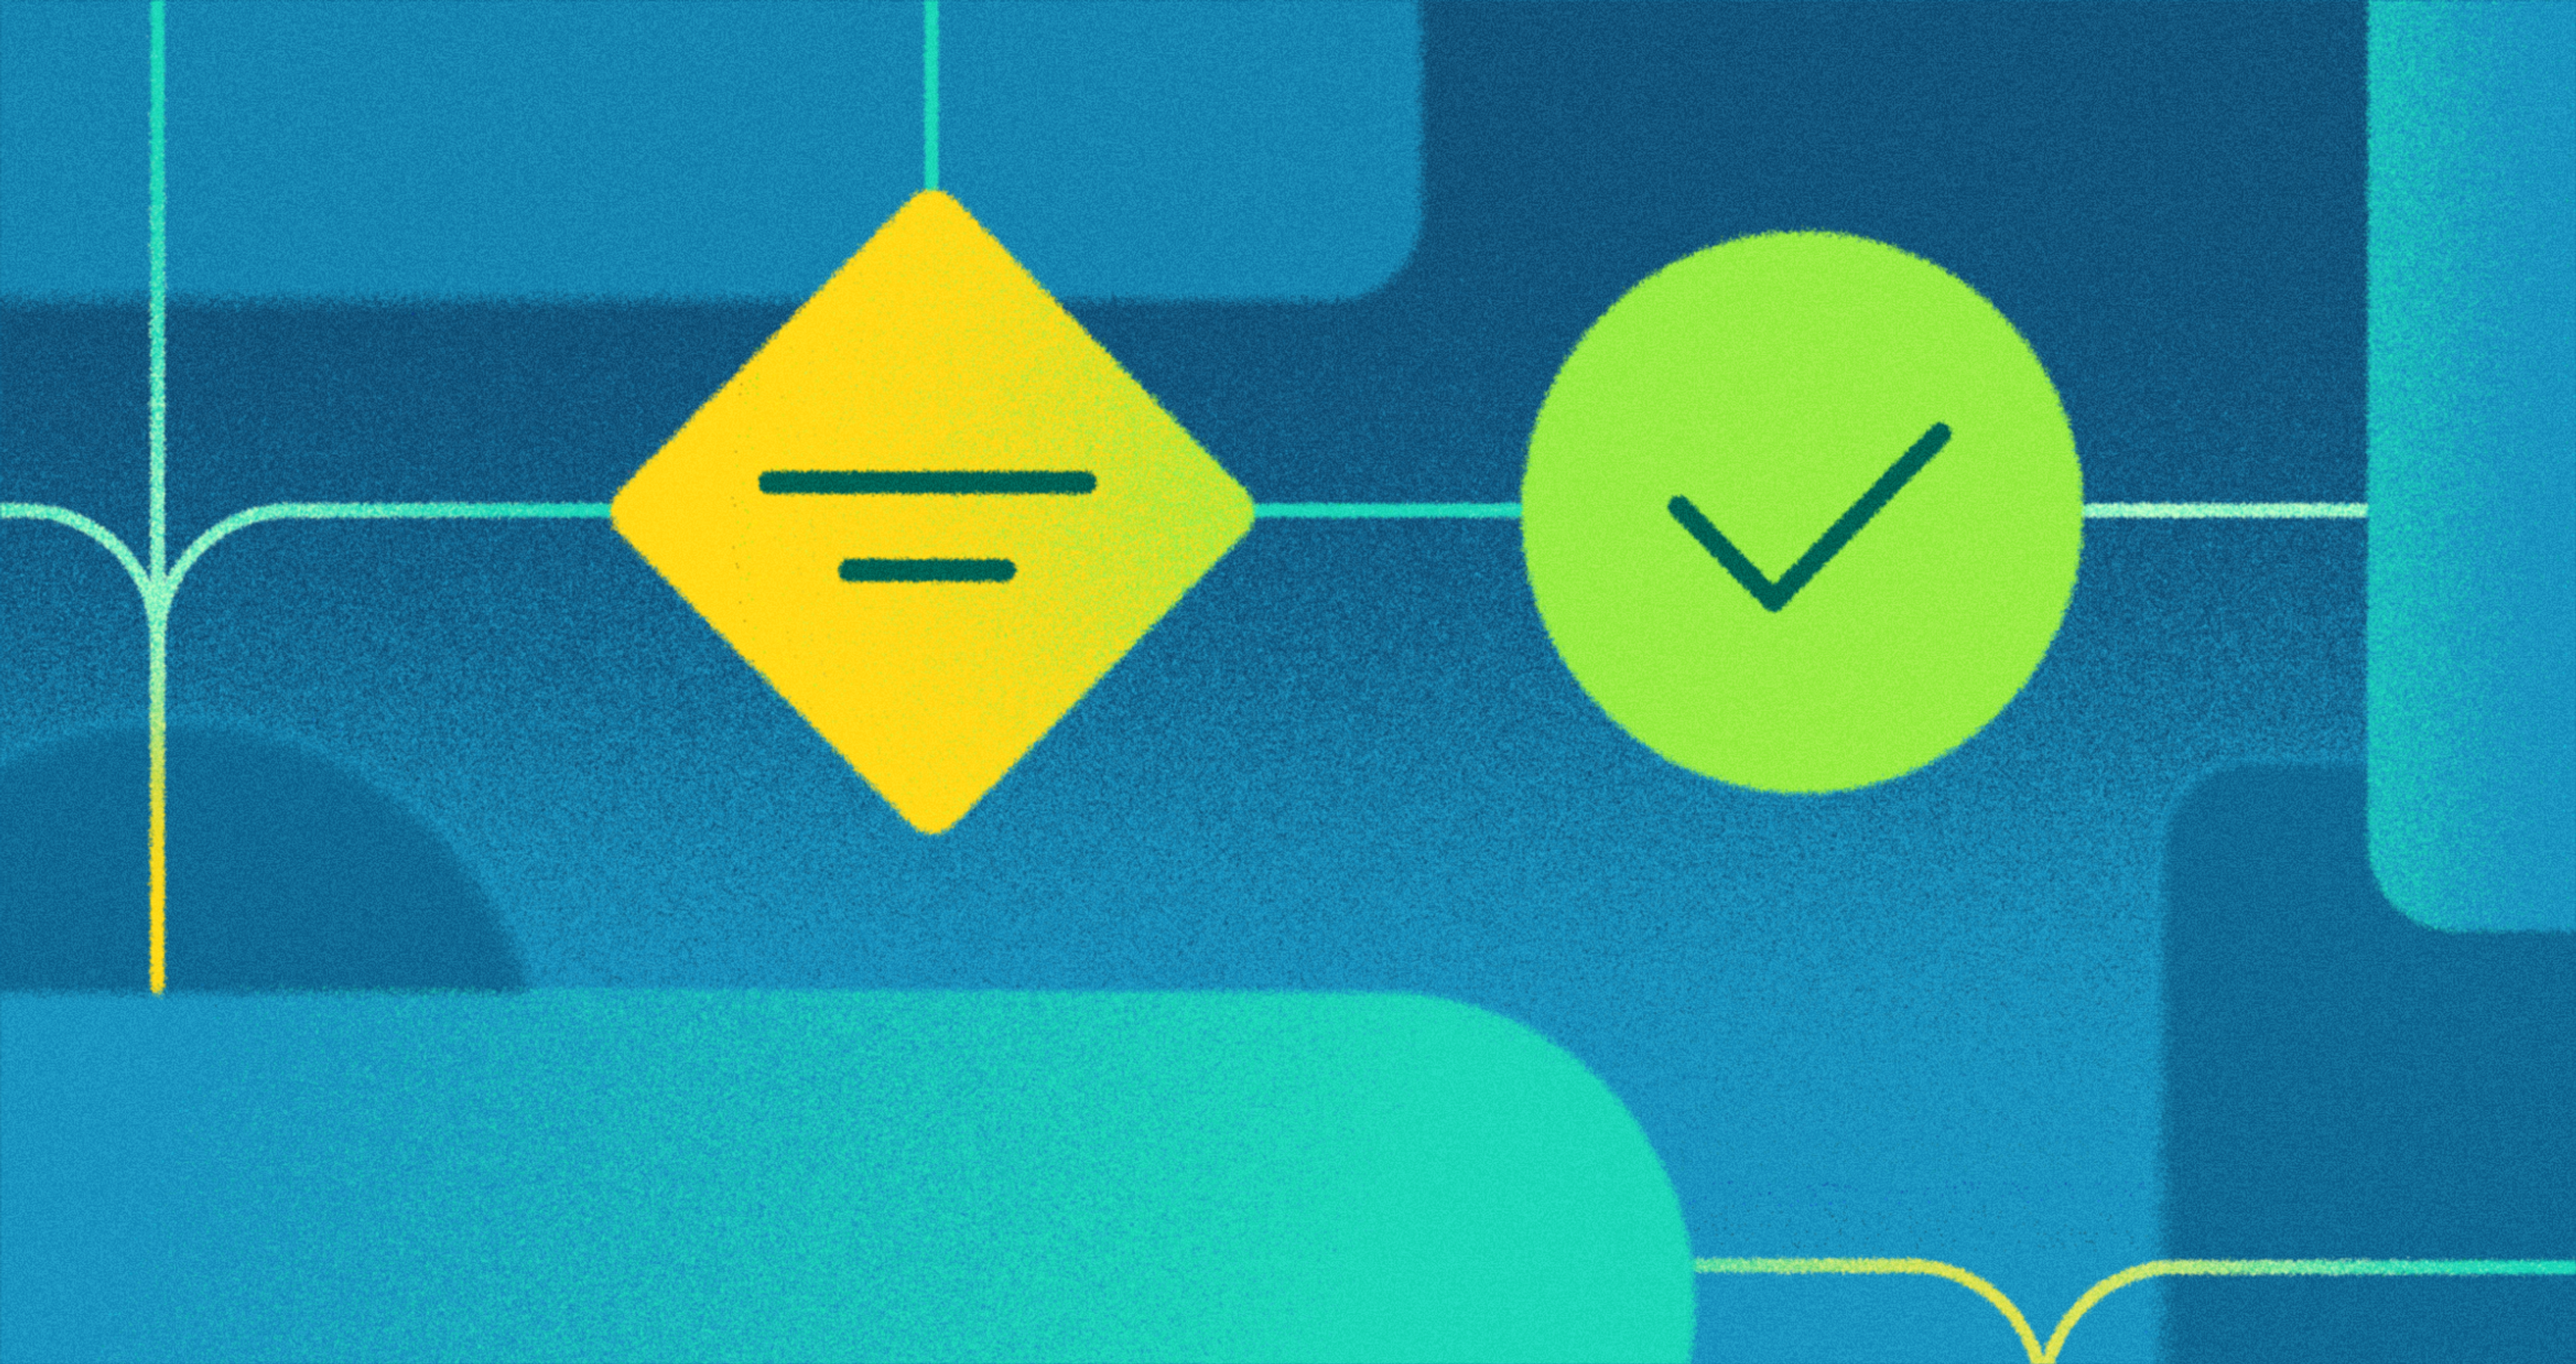
It Reduces Risk
Every design decision carries uncertainty. Without data, teams rely on opinions, which often leads to rework.
With data, you can validate ideas early. For example, testing multiple versions of a checkout flow before rollout helps avoid costly mistakes.
It Improves User Experience
Data reveals friction points that are not always visible during design reviews.
A heatmap might show that users ignore a key CTA. Session recordings might reveal confusion in navigation. These insights allow designers to fix real problems, not hypothetical ones.
It Aligns Teams Around Evidence
In modern product teams, decisions involve designers, developers, marketers, and stakeholders.
Data creates a shared language. Instead of debating preferences, teams can focus on what works.
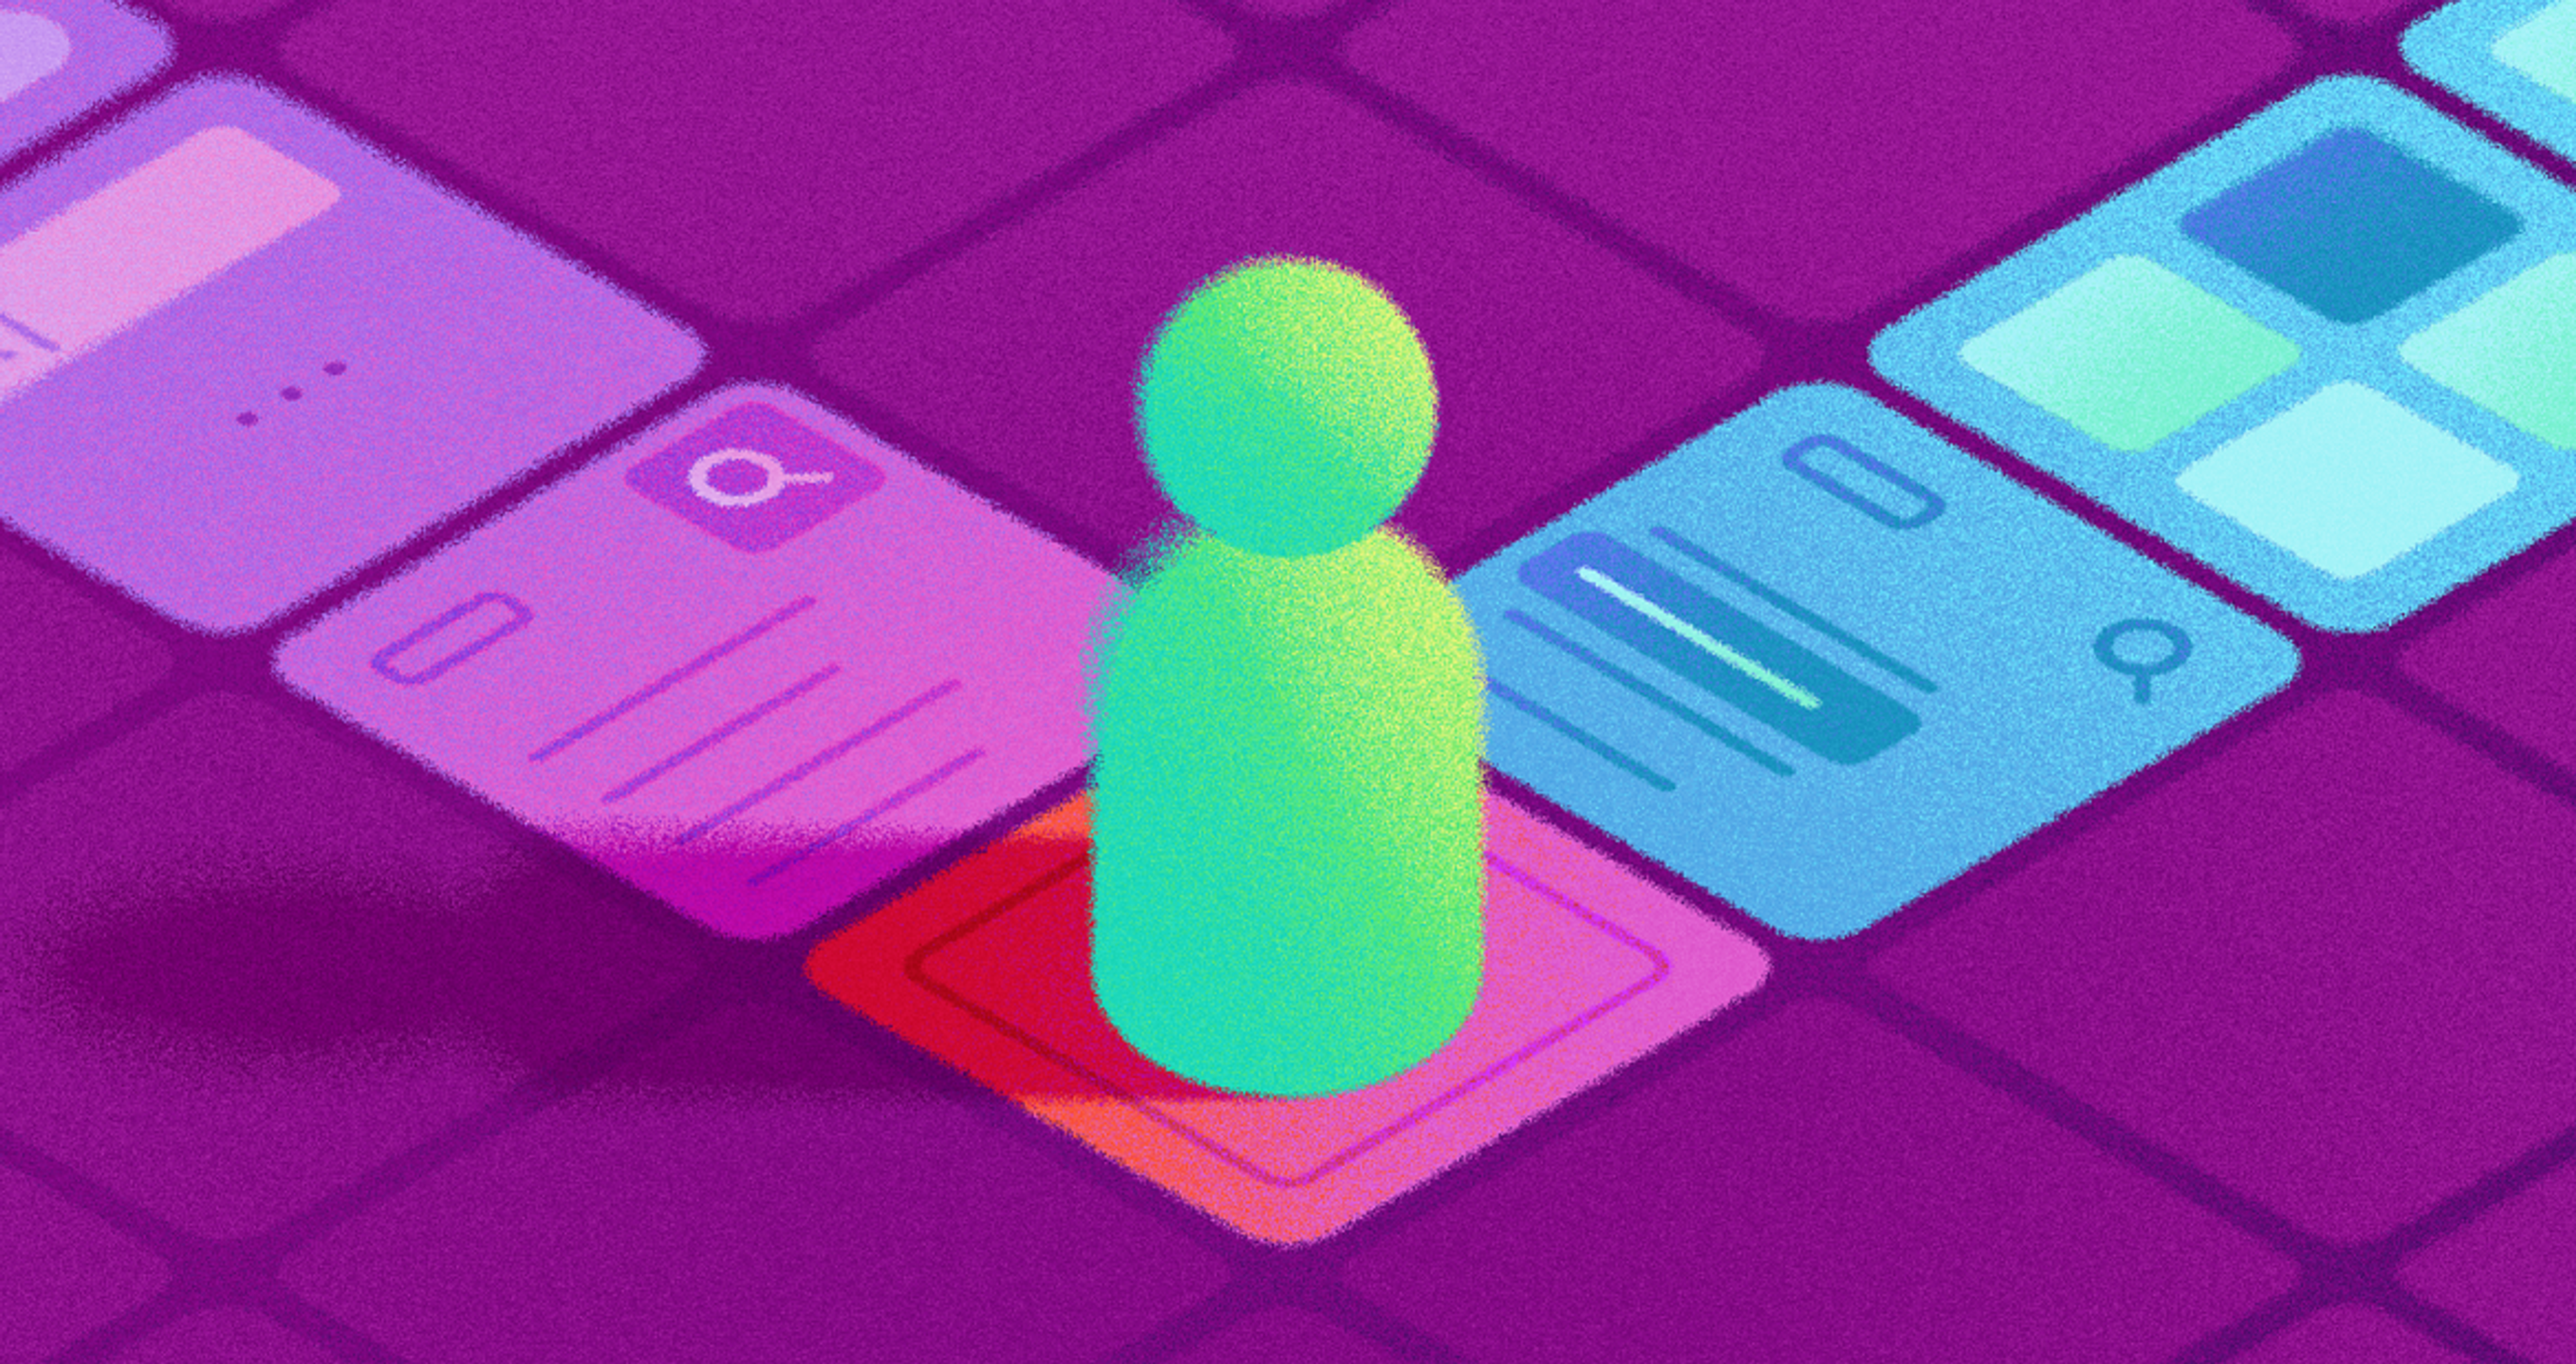
The Core Components of Data-Driven Design
Data-driven design is not a single method. It is a system that combines multiple sources of insight.
Quantitative Data: What Users Do
Quantitative Methods by Clay

Quantitative data shows patterns at scale.
This includes:
- Page views and click-through rates
- Conversion funnels
- Drop-off points
- Time on task
It answers questions like:
Where do users leave?
Which features are used most?
What paths lead to conversion?
However, it does not explain why those behaviors happen.
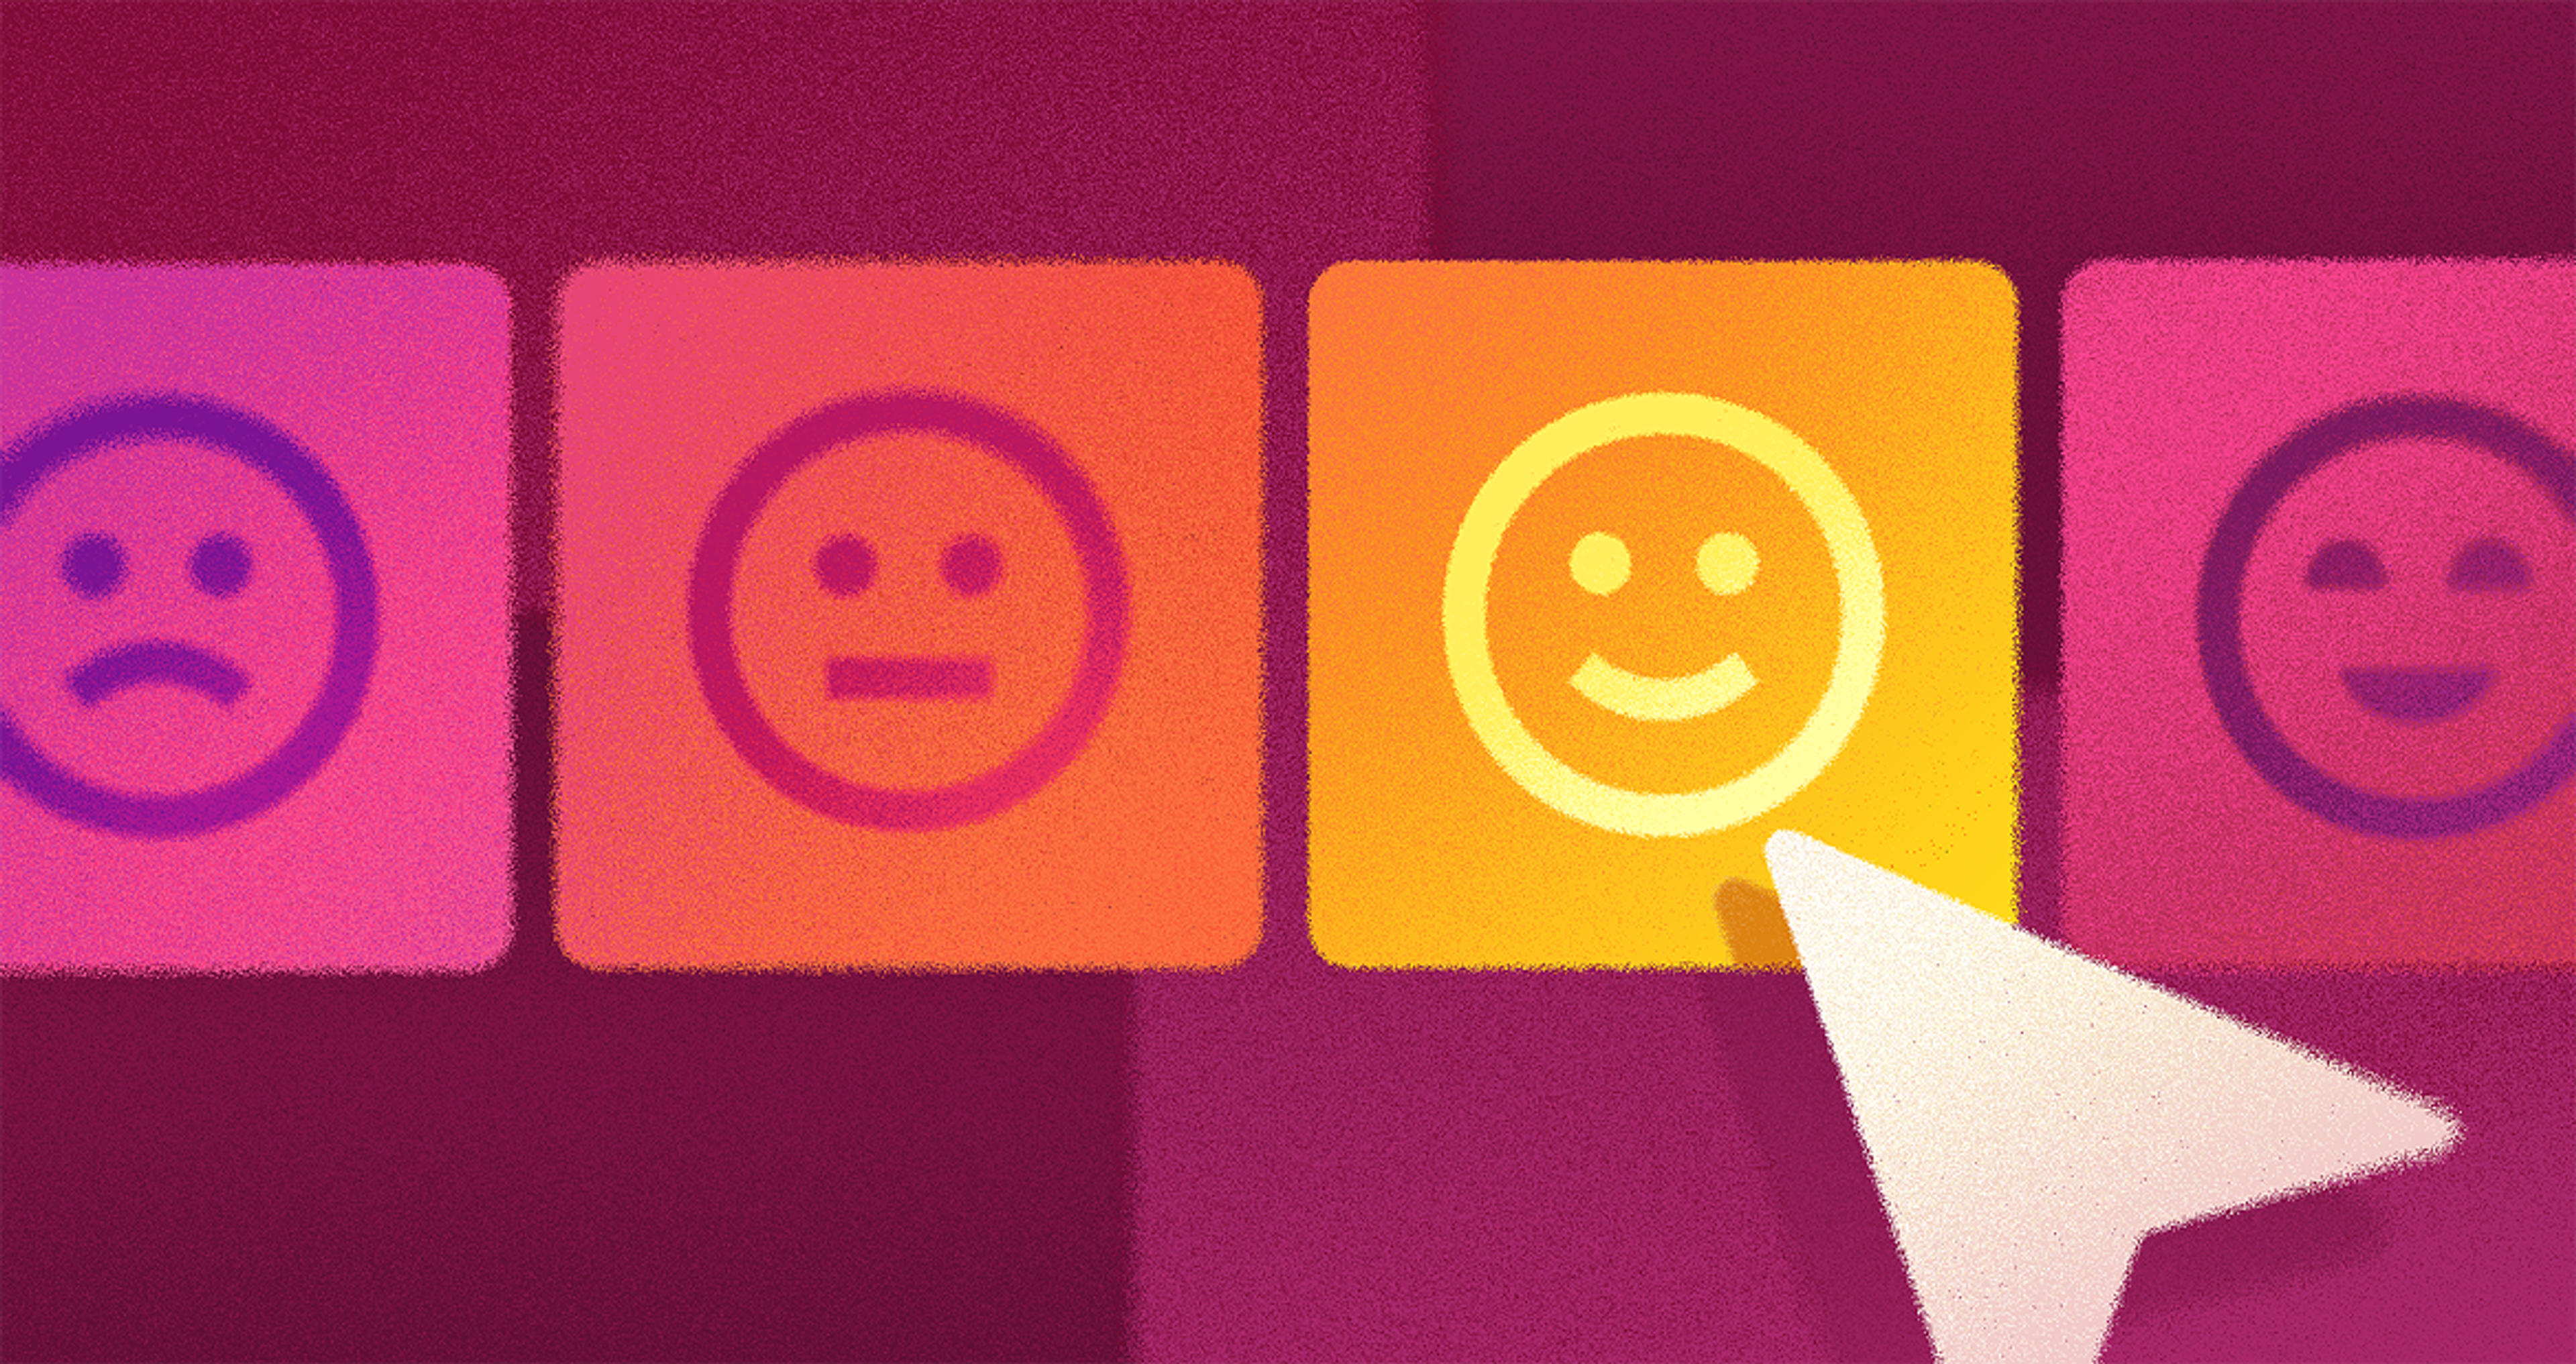
Qualitative Data: Why Users Behave That Way
Qualitative Methods by Clay

Qualitative insights add context.
Through user interviews, usability testing, and open-ended feedback, teams uncover motivations, frustrations, focus groups, and mental models.
For example, analytics might show users abandoning a form. Interviews might reveal that the language feels confusing or intrusive.
This combination is where real understanding happens.
Experimentation: Testing What Works
Experimentation bridges insight and action.
A/B testing, multivariate testing, and rapid prototyping allow teams to validate changes before full implementation.
In 2026, experimentation is faster and more integrated. Many platforms now support continuous testing, where variations adapt in real time based on performance.
AI and Predictive Insights
AI has transformed how teams work with data.
Instead of manually analyzing dashboards, designers now use tools that:
- Highlight anomalies automatically
- Predict user behavior
- Suggest design improvements
This does not replace designers. It augments their ability to spot patterns and make decisions faster.
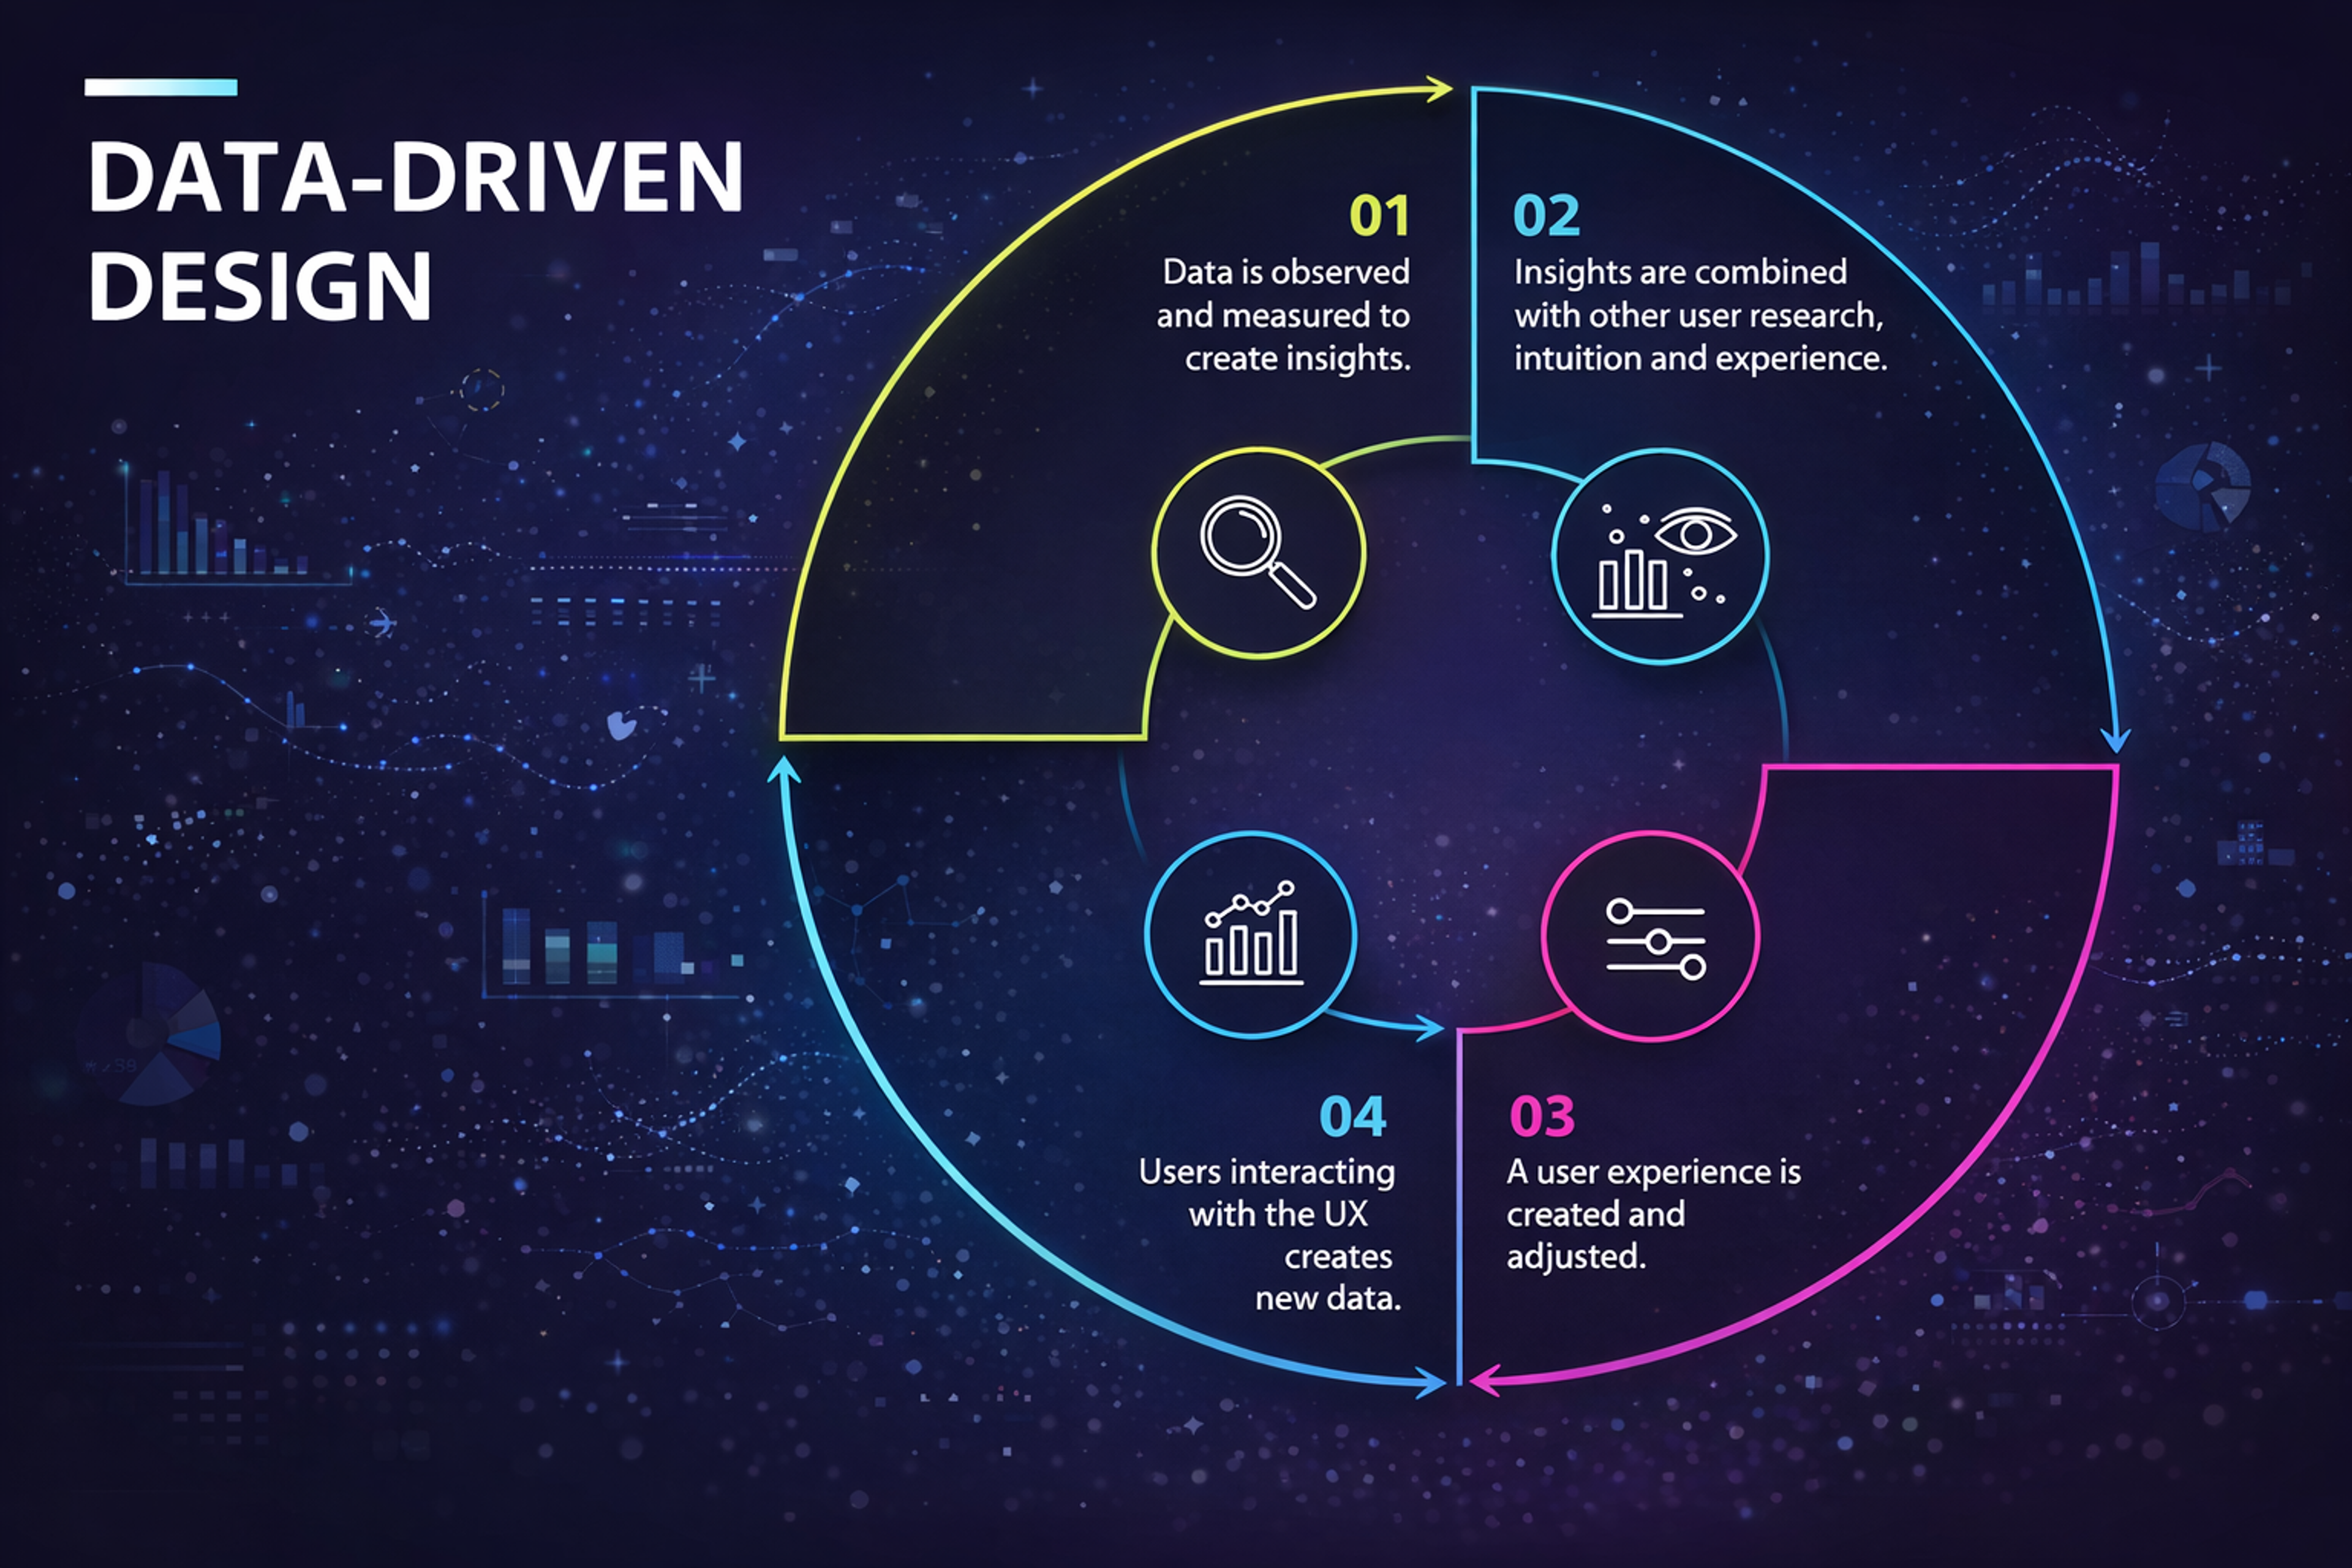
How the Data-Driven Design Process Works
While every team adapts the process, most follow a similar loop.
1. Define the Problem
Everything starts with a clear question.
For example, instead of asking “How can we improve the homepage?”, a stronger question would be:
Why are users not clicking the primary CTA?
Clear questions lead to actionable insights.
2. Gather Relevant Data
Next, collect data from multiple sources.
This might include analytics tools, user interviews, surveys, and session recordings.
The goal is not to collect more data, but to collect the right data.
3. Analyze Patterns
Look for consistent behaviors.
Where do users hesitate?
Which paths are most common?
What correlates with success?
In 2026, many teams rely on AI-assisted analysis to surface patterns quickly, but human interpretation remains essential.
Data Analysis Process
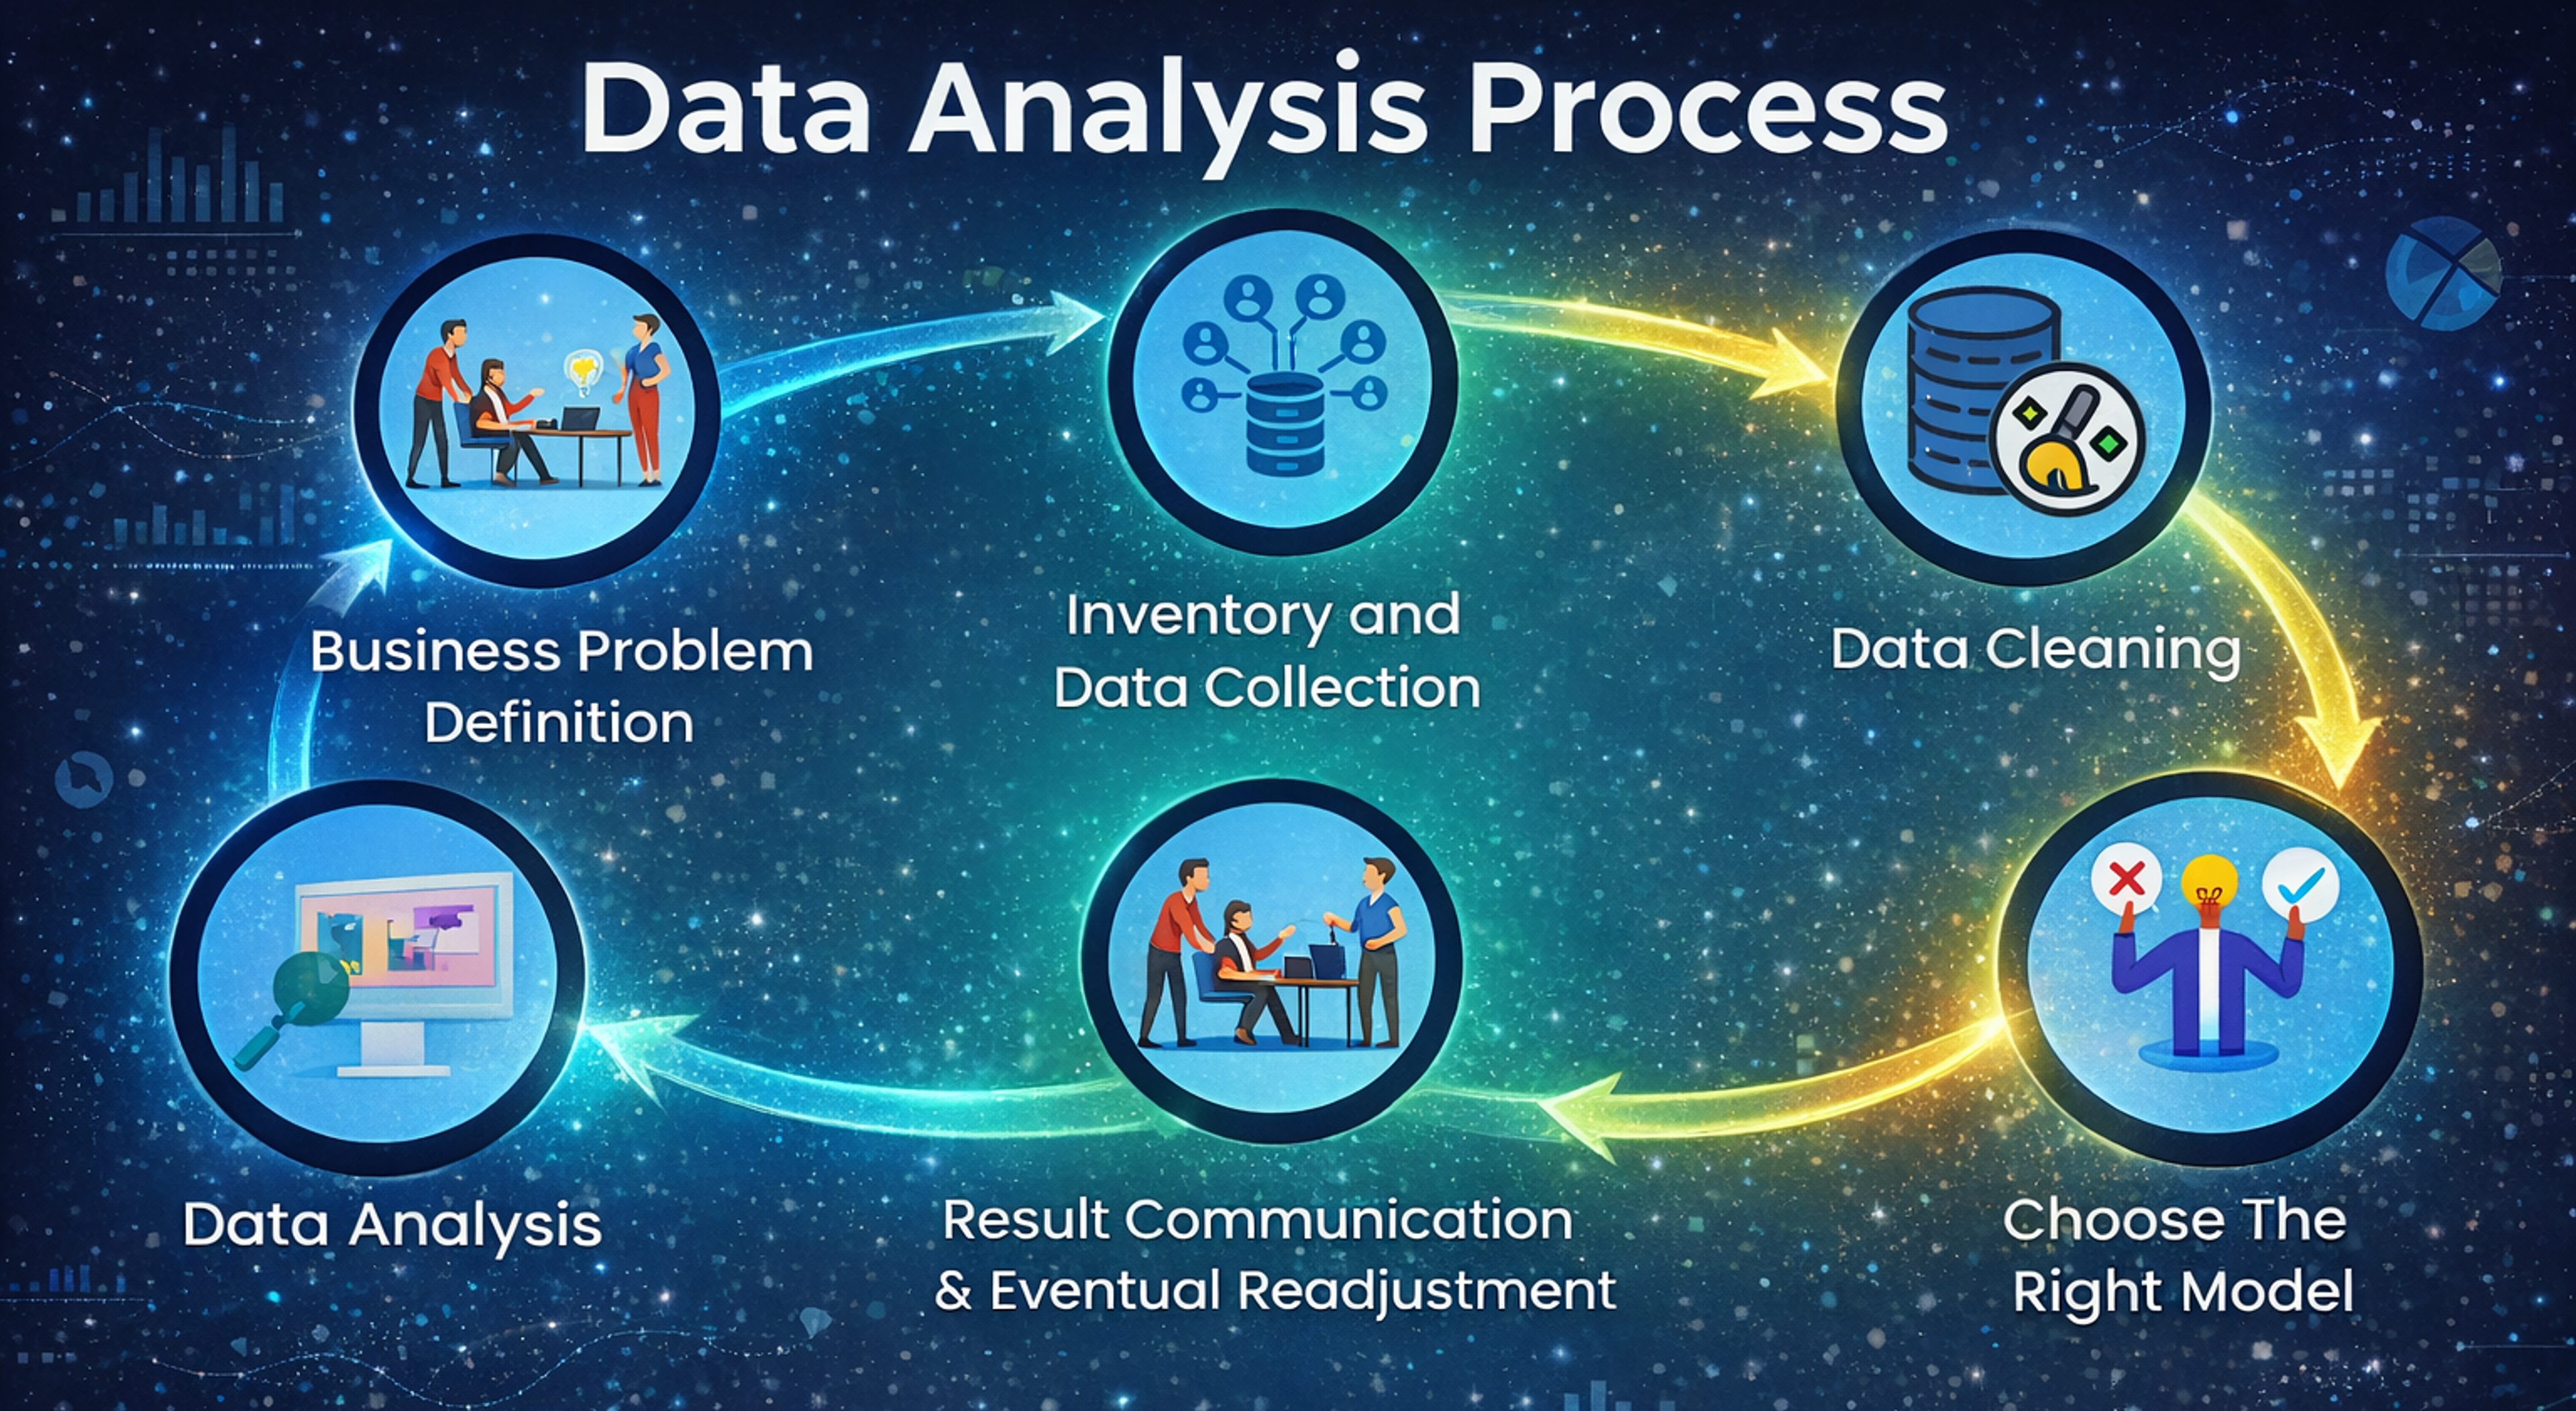
4. Form Hypotheses
Turn insights into testable ideas.
For example, if we simplify the form fields, users will complete the signup process more often.
This step connects data to design decisions.
5. Test and Iterate
Test your hypothesis through experiments.
Measure the impact, learn from the results, and refine the design.
This cycle repeats continuously. Data-driven design is not a one-time activity. It is an ongoing process.
Tools That Power Data-Driven UX in 2026
The tooling landscape has evolved significantly.
Modern teams rely on integrated ecosystems rather than isolated tools.
Analytics Platforms
Tools like Google Analytics 4, Mixpanel, and Amplitude provide deep behavioral insights.
They track user journeys, segment audiences, and measure performance across channels.
Heatmaps and Session Recordings
Platforms like Hotjar and FullStory visualize user behavior.
They show where users click, scroll, and struggle, offering a more intuitive view of interaction patterns.
User Research Tools
Remote testing platforms, interview tools, and survey systems make it easier to collect qualitative insights at scale.
AI-assisted transcription and analysis have reduced the time required to process feedback.
Experimentation Platforms
A/B testing tools allow teams to test variations quickly.
In 2026, many platforms will integrate directly with design systems, enabling faster deployment and iteration.
AI-Powered Insight Tools
These tools analyze large datasets and generate recommendations.
They help teams move from raw data to actionable insights more efficiently.
Common Mistakes in Data-Driven Design
Despite its benefits, data-driven design can fail when applied incorrectly.
Over-Reliance on Metrics
Not everything that matters can be measured easily.
Focusing only on metrics like clicks or conversions can lead to short-term optimizations that harm long-term experience.
For example, aggressive pop-ups might increase conversions but damage user trust.
Ignoring Context
Data without context can be misleading.
A drop in engagement might not be a design issue. It could be seasonal behavior, external factors, or changes in traffic sources.
Always interpret data within a broader context.
Analysis Paralysis
With so much data available, teams can get stuck analyzing instead of acting.
The goal is not perfect certainty. It is informed decision-making.
Misinterpreting Correlation as Causation
Just because two metrics move together does not mean one causes the other.
This is why experimentation is critical. Testing validates assumptions.
Balancing Data and Creativity
A common concern is that data-driven design limits creativity.
In reality, it does the opposite.
Data provides constraints and direction, which can lead to more focused and effective creativity.
For example, understanding that users struggle with onboarding does not dictate the solution. It opens space for creative problem-solving grounded in real needs.
The best teams treat data as a guide, not a rulebook.
Data-Driven Design for AI and Search Discovery
In 2026, UX design directly impacts how content and products are discovered.
Search engines, AI overviews, and conversational interfaces rely on structured, user-friendly experiences.
Data-driven design supports this by:
- Improving clarity and navigation, which helps systems interpret content
- Reducing friction, which increases engagement signals
- Structuring information in ways that are easy to extract and summarize
For example, clear headings, logical flows, and concise explanations make it easier for AI systems to surface content in answer-style results.
This is where UX and SEO fully converge.
Real-World Applications of Data-Driven UX
Data-driven design is not limited to one type of product.
E-commerce
Teams optimize product pages, checkout flows, and recommendations based on user behavior.
Even small changes, like adjusting button placement or simplifying forms, can significantly impact revenue.
SaaS Platforms
Product teams analyze feature usage and onboarding flows.
They identify where users drop off and refine experiences to improve retention.
Content Platforms
Publishers use data to understand how users consume content.
They optimize layout, readability, and navigation to increase engagement and discoverability.
The Future of Data-Driven Design
Looking ahead, data-driven design will become even more dynamic.
Interfaces will adapt in real time based on user behavior. AI will play a larger role in generating and testing design variations. Personalization will move beyond segments to individual-level experiences.
At the same time, privacy and ethical considerations will become more important.
Designers will need to balance personalization with transparency and trust.
The core principle will remain the same. Use data to serve users better, not to manipulate them.
FAQs
What is the difference between data-driven design and user-centered design?
User-centered design focuses on understanding user needs and behaviors. Data-driven design uses measurable insights to inform decisions. In practice, they overlap and work best together.
Is data-driven design only about analytics?
No. It includes both quantitative data, like analytics, and qualitative insights, like user interviews and usability testing.
Can small teams use data-driven design effectively?
Yes. Even basic tools like analytics platforms and user feedback surveys can provide valuable insights for small teams.
How much data do you need to make decisions?
You do not need large datasets. The key is having relevant data that answers your specific question.
Does data-driven design replace intuition?
No. It complements intuition. Designers still use judgment, but data helps validate decisions.
What are the best tools for data-driven UX?
Popular tools include Google Analytics, Mixpanel, Hotjar, FullStory, and various A/B testing platforms. AI-powered tools are increasingly common as well.
How do you avoid bias in data interpretation?
Use multiple data sources, test hypotheses, and involve diverse team perspectives to reduce bias.
What is A/B testing in UX design?
A/B testing compares two versions of a design to see which performs better based on user behavior.
How does data-driven design improve conversions?
By identifying friction points and optimizing user flows, it increases the likelihood that users complete desired actions.
Is data-driven design important for SEO?
Yes. Better UX leads to stronger engagement signals, which can improve visibility in search and AI-driven discovery.
What role does AI play in data-driven design?
AI helps analyze data, identify patterns, and generate insights faster, but human interpretation is still essential.
How often should you test design changes?
Continuously. Data-driven design is an ongoing process, not a one-time activity.
What are common KPIs in UX design?
Common metrics include conversion rate, bounce rate, task success rate, and user retention.
How do you balance personalization and privacy?
Be transparent about data usage, give users control, and prioritize ethical design practices.
What is the biggest challenge in data-driven design?
Interpreting data correctly and turning insights into meaningful design improvements without overcomplicating the process.
Read More
Conclusion
If you’re working with a startup UI/UX design agency, align early on how data will guide the UX process. Data reveals user needs and behaviors, but it should be balanced with context and qualitative insight.
Product success often depends on UX quality. Using data well helps you build stronger experiences and stay competitive.

About Clay
Clay is a UI/UX design & branding agency in San Francisco. We team up with startups and leading brands to create transformative digital experience. Clients: Facebook, Slack, Google, Amazon, Credit Karma, Zenefits, etc.
Learn moreAbout Clay
Clay is a UI/UX design & branding agency in San Francisco. We team up with startups and leading brands to create transformative digital experience. Clients: Facebook, Slack, Google, Amazon, Credit Karma, Zenefits, etc.
Learn more