Every click, scroll, and pause tells a story. When someone visits your website or opens your app, they leave behind clues about what works and what doesn’t - clues that come from real users.
Understanding user behavior patterns helps you build better digital products because patterns are repeatable signals, not one-off actions.
Instead of tracking single clicks or scrolls, you look for sequences like repeated tapping, backtracking, or drop-offs at the same step.
These patterns show what keeps users moving and where they get stuck, so you can turn analytics into clear UX fixes.
Common User Behavior Patterns
- Rage clicks: repeated rapid clicks on the same element often signal frustration, a broken interaction, or unclear UI.
- Dead clicks: users click something that looks interactive, but nothing happens.
- Backtracking: users bounce between pages or steps because they cannot find what they need.
- Form abandonment: users start a form and leave mid-way due to effort, uncertainty, or unexpected requirements.
- Scroll drop-off: users do not reach key content or CTAs because the value is not clear early or the page feels too long.
- Repeated search or filter changes: users keep refining because labels are unclear or results do not match intent.
The key is to connect patterns to outcomes. Find which patterns correlate with drop-offs or low conversion, then redesign the step that causes the friction.
What Is User Behavior?
User behavior covers every action someone takes in your digital product. They click buttons, scroll pages, and spend time reading content. They navigate menus, fill forms, and abandon carts.
These actions create patterns. Some patterns signal success, as users find what they need and complete their goals. Others expose problems, including confusion, frustration, or dead ends.
When you track these patterns, you understand how people actually use your product. User behavior tracking involves using analytics data and quantitative data to track user behavior and uncover actionable insights.
Key signals include where users spend time, what they click, and where they leave. These tell you what attracts attention and what causes problems.
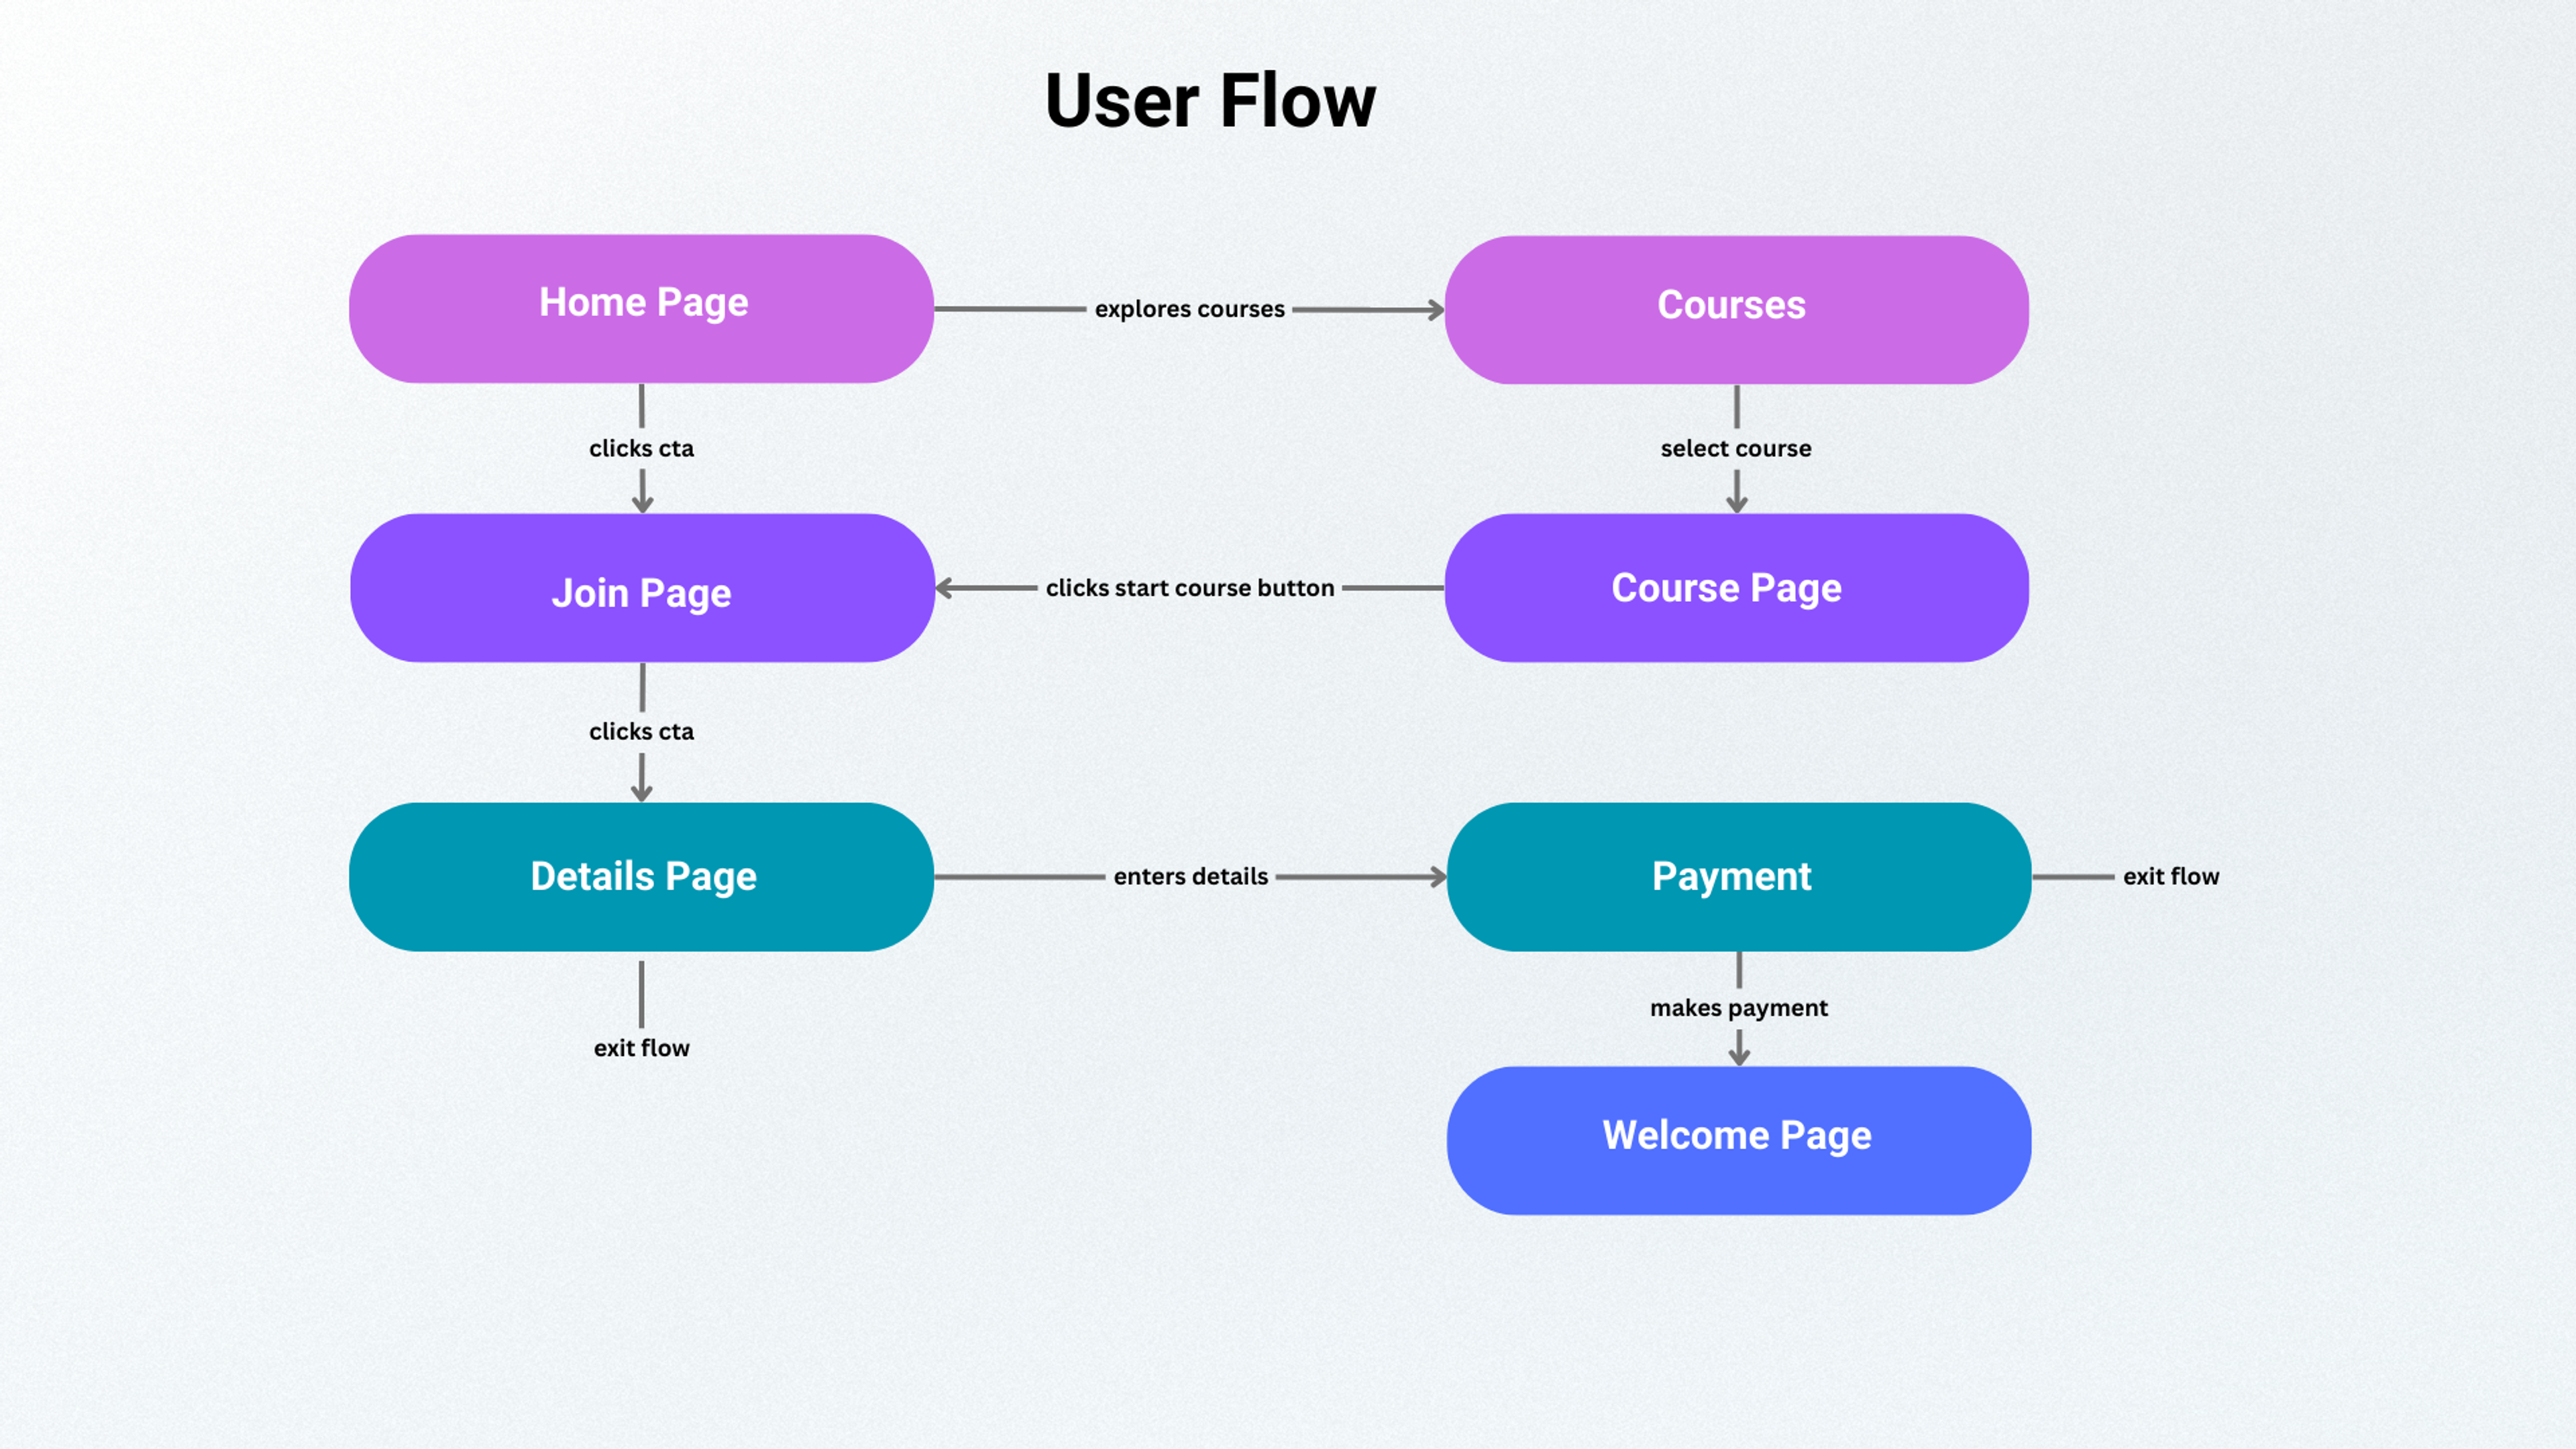
User Flow Example
Why Analyzing User Behavior Matters
Create Experiences That Feel Personal
Generic experiences feel hollow. When you understand behavior patterns, you can show people what matters to them.
Someone browsing winter coats doesn’t need summer dress recommendations. Someone reading beginner tutorials doesn’t need advanced troubleshooting guides.
Match content to behavior and users feel understood. Understanding user preferences is key to delivering personalized experiences. They stay longer, engage more, and come back.
Make Decisions Based on Reality
Guessing wastes time and money. User behavior data shows what actually happens, not what you hope happens.
You might think your checkout process is simple. But if behavior data shows users abandoning at step three, you have real evidence of a problem.
This evidence guides smart changes. Analyzing user behavior data helps identify areas that need improvement. You fix actual issues instead of imagined ones.
Stay Ahead of Competitors
Behavioral patterns reveal emerging trends before they become obvious. You notice shifts in how people interact with your product.
Maybe mobile users start preferring video content over text. Or users begin abandoning features you thought were popular.
Spotting these changes early lets you adapt while competitors are still catching up. Gaining deeper insights into user behavior trends through advanced analytics and feedback methods gives you a significant competitive advantage.
Keep Customers Coming Back
Users leave when products frustrate them. They return when products work smoothly.
Behavior analysis shows exactly where friction occurs. You see the confusing navigation, the broken checkout flow, or the feature nobody can find.
Fix these pain points and satisfaction rises. Improving user satisfaction leads to increased customer loyalty. Happy users become loyal customers who recommend your product to others.
User Behavior Analytics (UBA)
User Behavior Analytics (UBA) means collecting and studying interaction data to improve digital experiences. It turns raw information into actionable insights.
Three elements form the foundation: journey mapping, behavioral segmentation, and experience analytics.
Journey mapping tracks every step from first visit to conversion. Mapping the user journey and customer journey helps visualize user interactions and user behaviors across the product lifecycle. You see where users enter, how they navigate, and where they exit.
Behavioral segmentation groups users by their actions. Power users behave differently than casual visitors. First-time shoppers differ from repeat customers.
Experience analytics measures how users feel during interactions. It captures satisfaction, frustration, and confusion.
Together, these elements create a complete picture of user interaction.
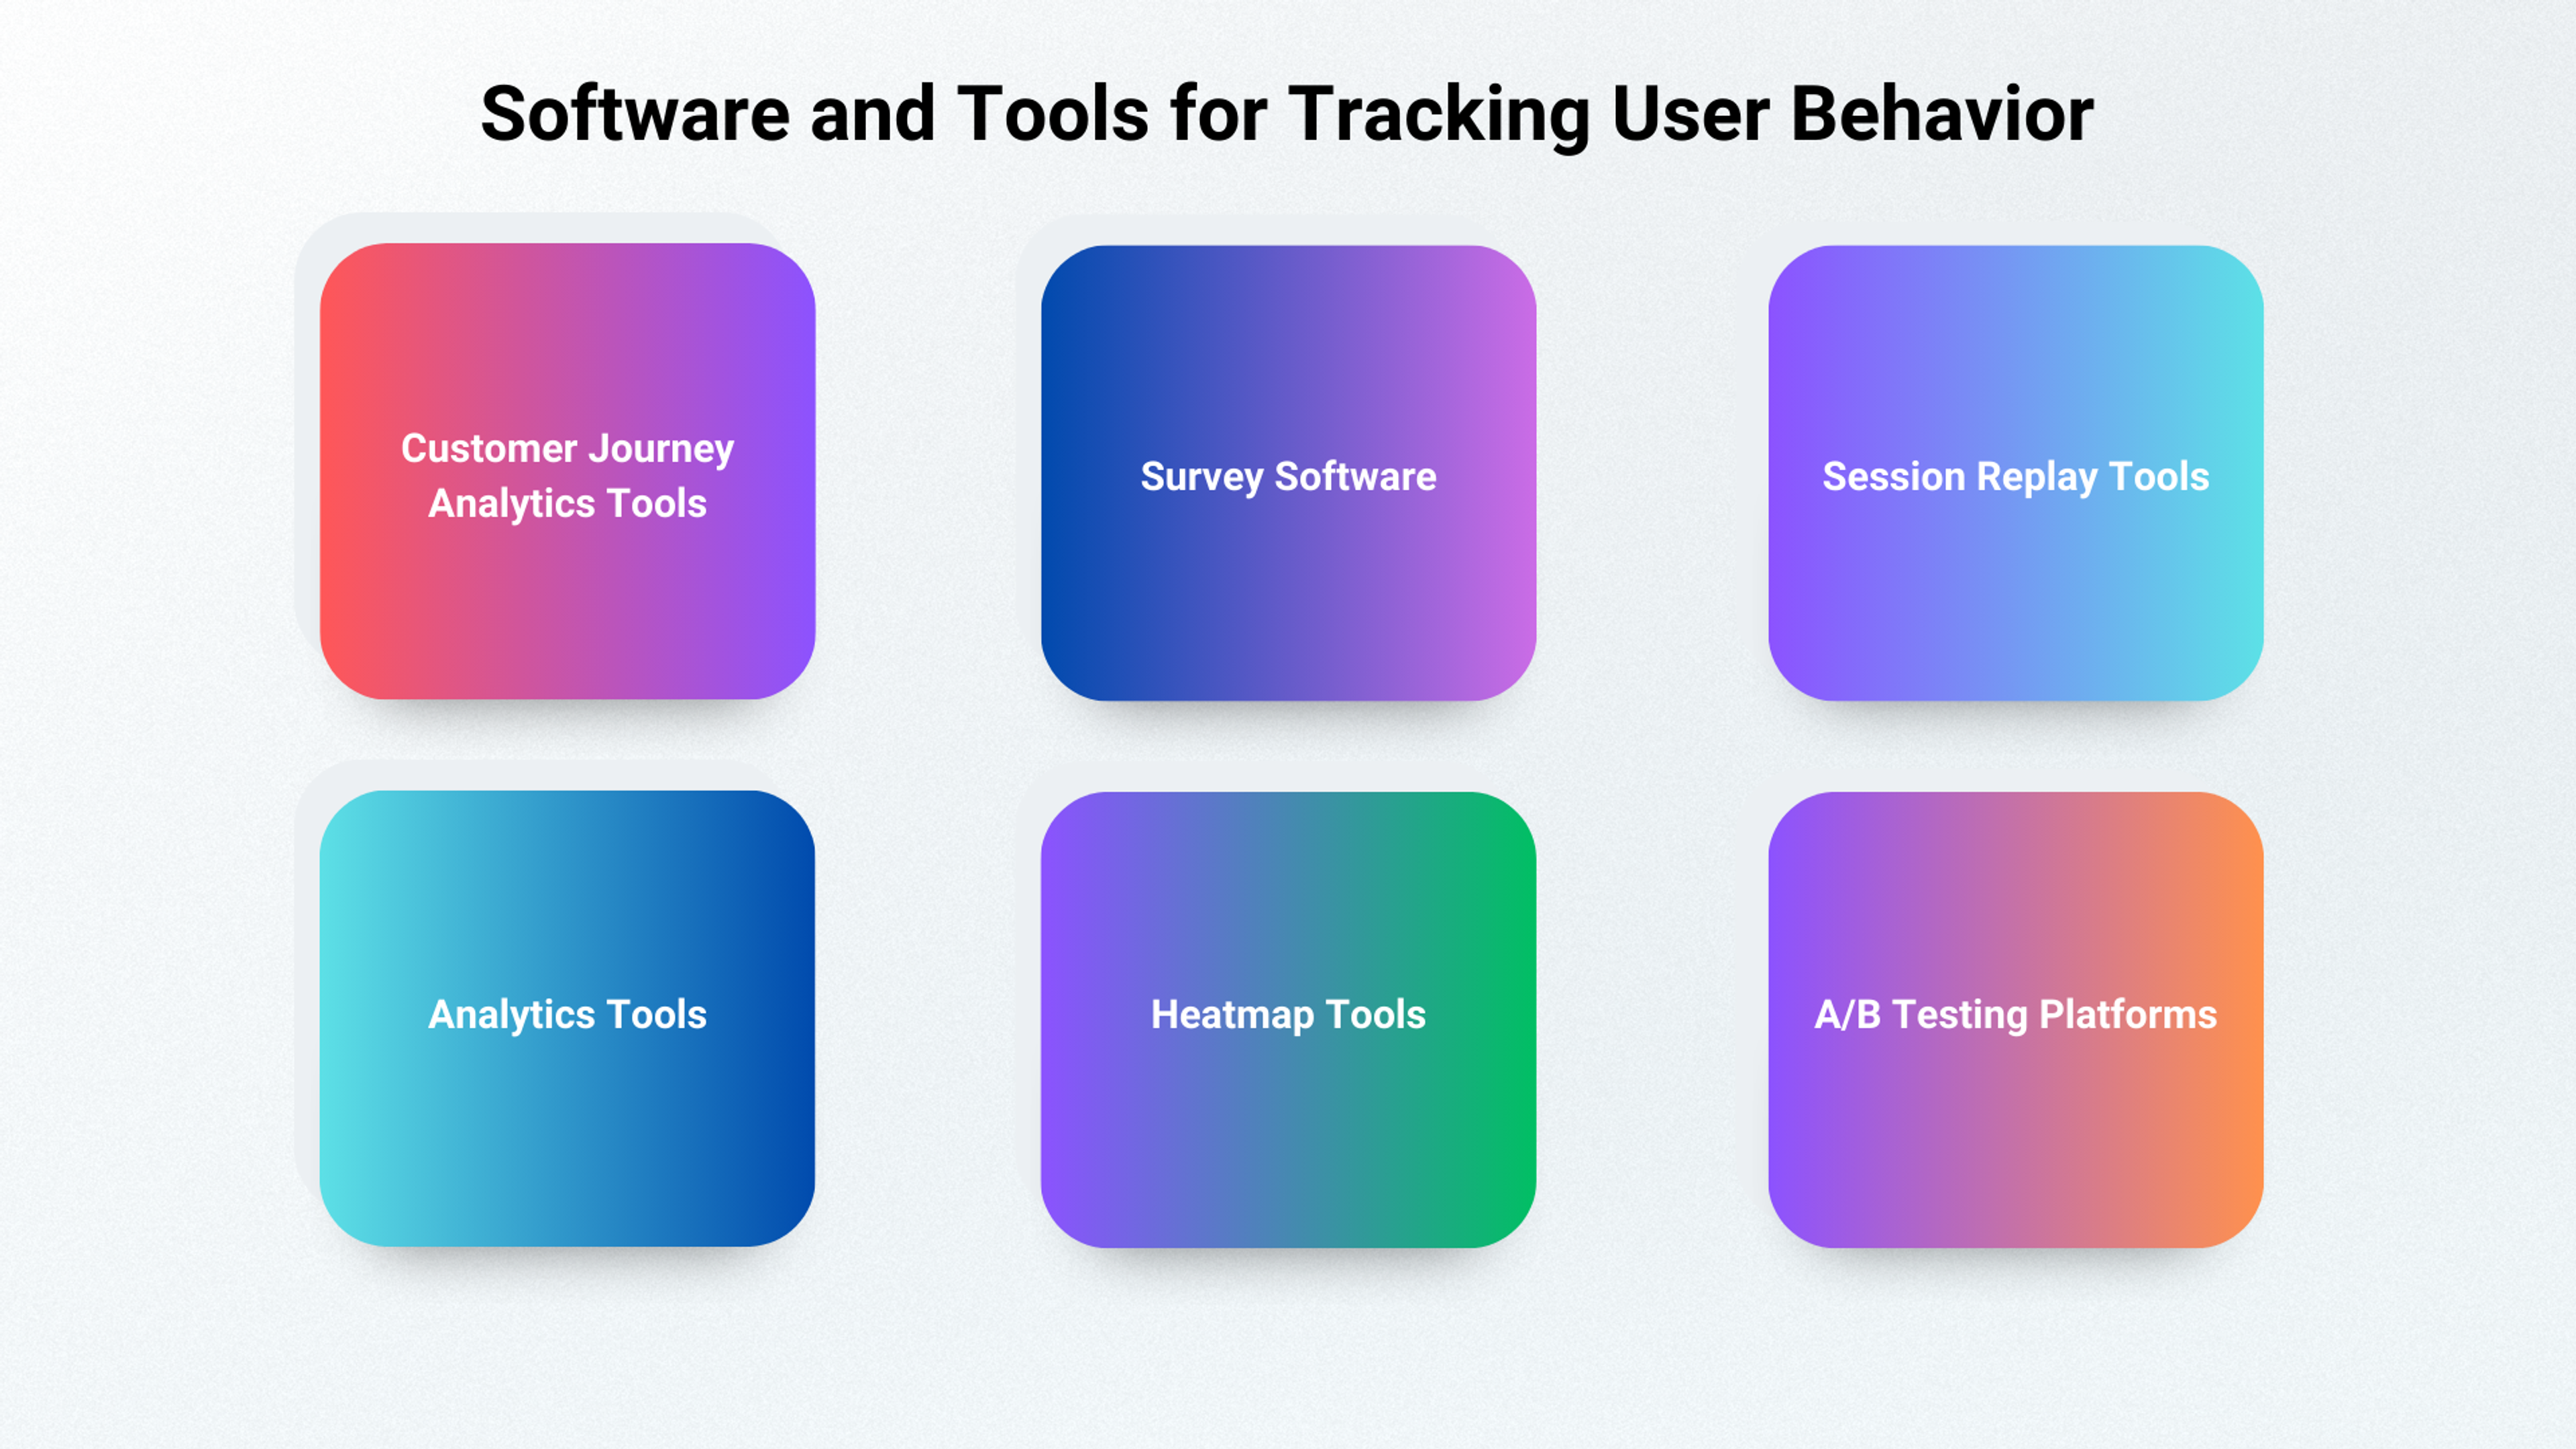
Software and Tools for Tracking User Behavior
Benefits of User Behavior Analytics
Design Better Experiences
Deep behavioral analysis reveals what users actually want. You discover which content resonates and which features matter most.
This knowledge drives better recommendations. Users see relevant options instead of random suggestions.
Navigation becomes intuitive when based on real usage patterns. Interfaces adapt to how people actually work instead of forcing them into predetermined paths. By using user behavior data to optimize flows, you can create smoother user journeys.
Find and Fix Problems
Behavior analysis exposes confusion points before they become major issues. You spot where users hesitate, backtrack, or give up.
Common problems include unclear buttons, hidden features, and complicated processes. Maybe your search function doesn’t work as expected. Or users can’t find the help they need.
Identifying these issues lets you fix them quickly. User behavior analytics helps identify pain points that hinder user experience. Fewer obstacles mean more satisfied users.
Increase Conversions
Understanding behavioral trends improves your entire sales funnel. You learn when users are ready to act and what motivates them. By tracking user behavior through the conversion funnel, you can pinpoint when users take the desired action and identify opportunities to improve conversion rates.
Maybe users need more product information before buying. Or they respond better to urgency signals near checkout.
Place the right prompts at the right moments and conversions increase naturally.
Predict Future Trends
Patterns show more than current behavior. They also point to future needs. You can spot shifting preferences before they spread.
This foresight helps you adapt strategies proactively. Launch new features when users are ready. Enter markets before they become saturated.
Anticipating change keeps you relevant as user needs evolve. Monitoring trends among existing users helps inform future product strategies.
Make Informed Decisions
Comprehensive behavioral data eliminates guesswork from important decisions. You have evidence for product changes, marketing approaches, and feature development.
This justifies resource allocation. Teams spend time on improvements that matter instead of changes nobody wants. Tracking key metrics ensures decisions are based on measurable outcomes, helping teams focus on what truly drives engagement and business growth.
How Organizations Use UBA
Detect Security Threats
Unusual behavior patterns often signal security problems. Someone logging in from an unexpected location raises questions. Accessing large amounts of data suddenly seems suspicious.
UBA establishes normal behavior baselines for each user. Monitoring individual users, specific users, and all the users collectively helps detect anomalies and potential threats by identifying deviations at both the individual and group levels.
Security teams respond faster when they know exactly what looks wrong.
Optimize Products
Navigation analysis reveals friction points throughout your product. Tracking user activity across key web pages helps identify where users encounter issues. You see which features users love and which they ignore.
High drop-off rates on specific pages indicate problems. Maybe the page loads slowly or the content confuses users.
Product teams use this information to prioritize improvements. They focus on changes that impact the most users.
Personalize Marketing
Retailers tailor content and recommendations using behavior data. Understanding what brings users and website visitors to your site helps refine marketing strategies. Each user sees products matching their interests and browsing history.
Someone frequently viewing running shoes gets athletic content. Another person browsing formal wear sees different recommendations.
This personalization increases engagement and sales. Users find what they want faster.
Prevent Fraud and Ensure Compliance
UBA Use Cases
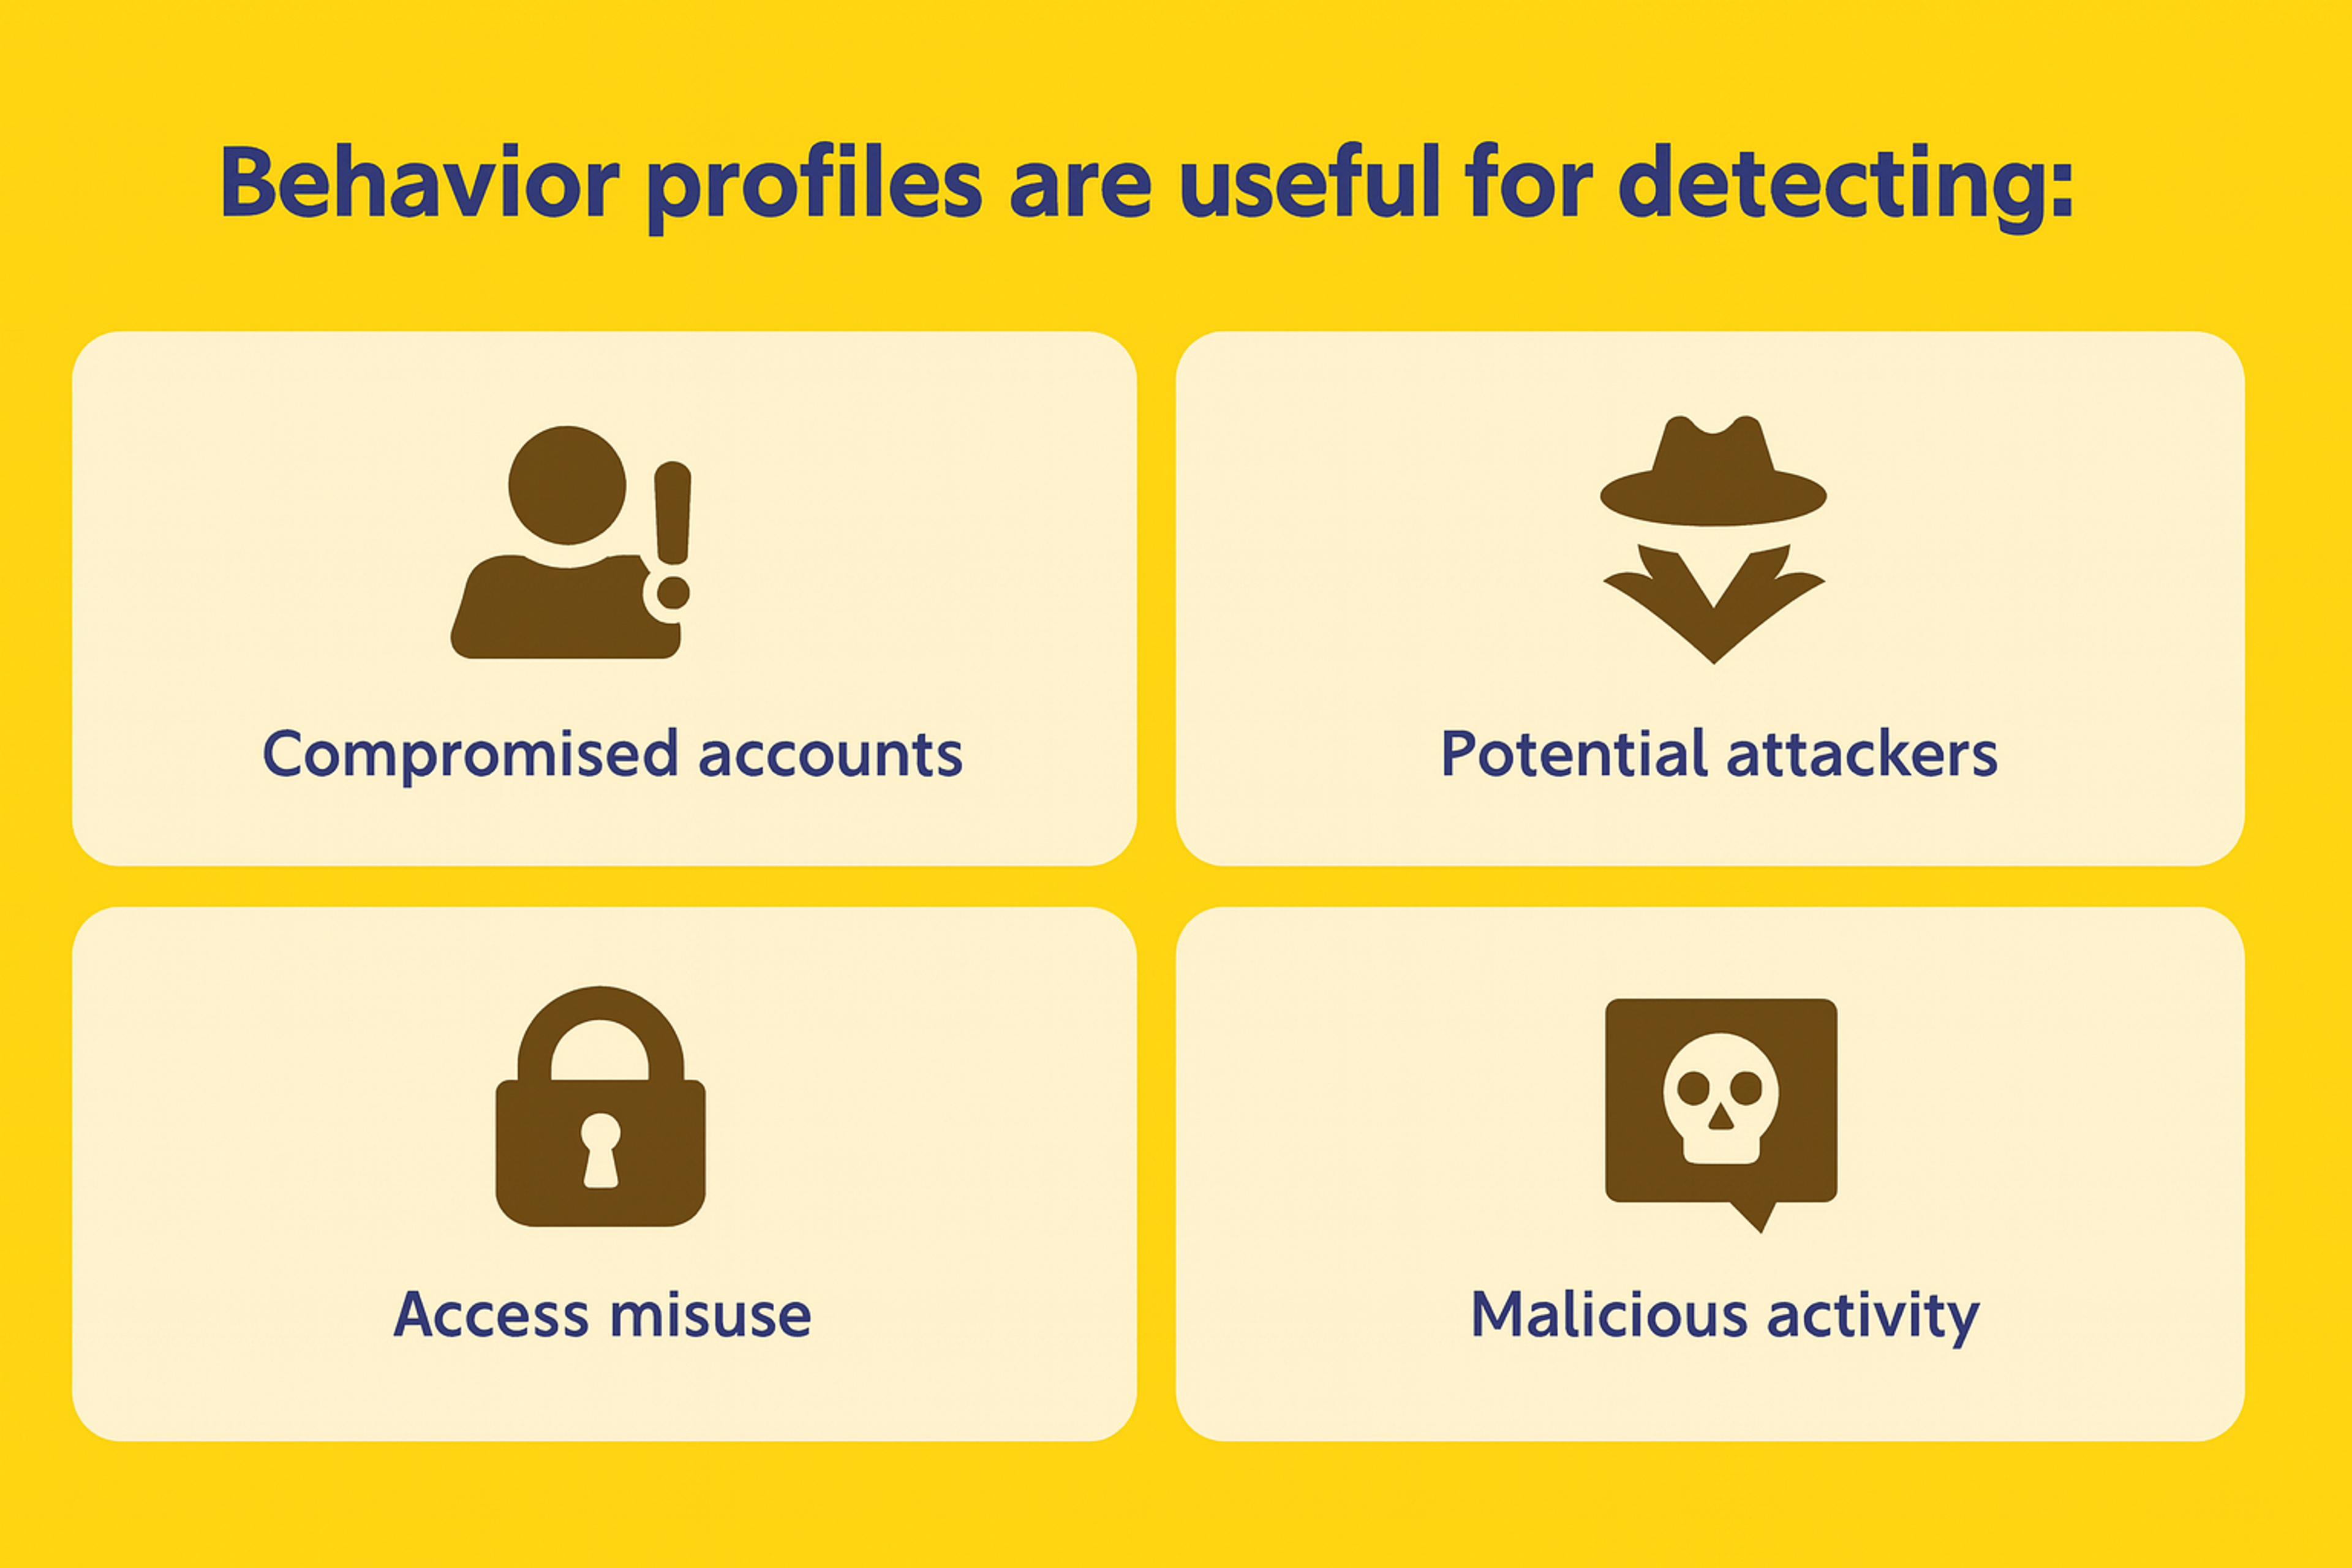
Monitoring behavior helps detect policy violations and fraudulent activity. Repeated attempts to access restricted information look suspicious. Unusual transaction patterns need investigation.
Financial services and healthcare rely heavily on behavioral monitoring. Breaches in these industries have serious consequences.
Early detection prevents small issues from becoming major problems.
Collecting User Behavior Data
Essential Practices
Combine different data sources for complete understanding. Traditional analytics provide numbers. Behavior tracking reveals patterns. User feedback explains why patterns exist.
Tracking user behavior combines these approaches, offering a comprehensive view that helps uncover actionable insights for improving user experience and conversion rates.
Track three core areas: activity, engagement, and retention.
Activity shows how often users return. Engagement measures how intensely they use your product. Retention indicates whether they stick around long-term.
Together, these metrics paint a complete picture.
Behavioral Analytics Tools
Google Analytics provides detailed traffic patterns and usage trends. It shows how users find and navigate through your site.
Heatmap Visualization Tools like Userpilot and Hotjar display where users click and scroll, revealing interaction hotspots and ignored areas. These tools create visual maps that make user behavior patterns immediately clear.
Session Replay Analysis tools allow real-time tracking of actual user behavior. You can watch exactly how users navigate through your product and where they encounter problems.
Advanced Analytics Platforms like Amplitude and Mixpanel offer deeper insights into user journeys and behavioral patterns. These tools excel at conversion funnel analysis and predictive user modeling.
Behavioral Segmentation Tools help group users based on their actions and preferences. This enables targeted approaches for different user types and improves personalization efforts.
Source: analytics.google

Mapping the User Journey
Journey maps show the full path from discovery to conversion. They outline each stage and highlight improvement opportunities.
Coordinate all touchpoints so experiences flow smoothly. Messaging stays consistent whether users browse on mobile or desktop.
Visualizing user flows reveals common routes and abandonment points. Analyzing how users navigate through your site helps identify drop off points in the user journey, so you can address where visitors tend to exit or abandon the process.
Include demographic information, motivations, and typical activities. Rich context makes it easier to design experiences that work.
User Feedback and Sentiment Analysis
Capture Emotional Responses
Emotion analysis reveals how users feel during interactions. Frustration, delight, confusion - these emotions drive behavior.
Positive emotions indicate success. Negative emotions pinpoint problems needing attention.
Understanding emotional drivers helps you create more satisfying experiences.
UBA Feedback Loop
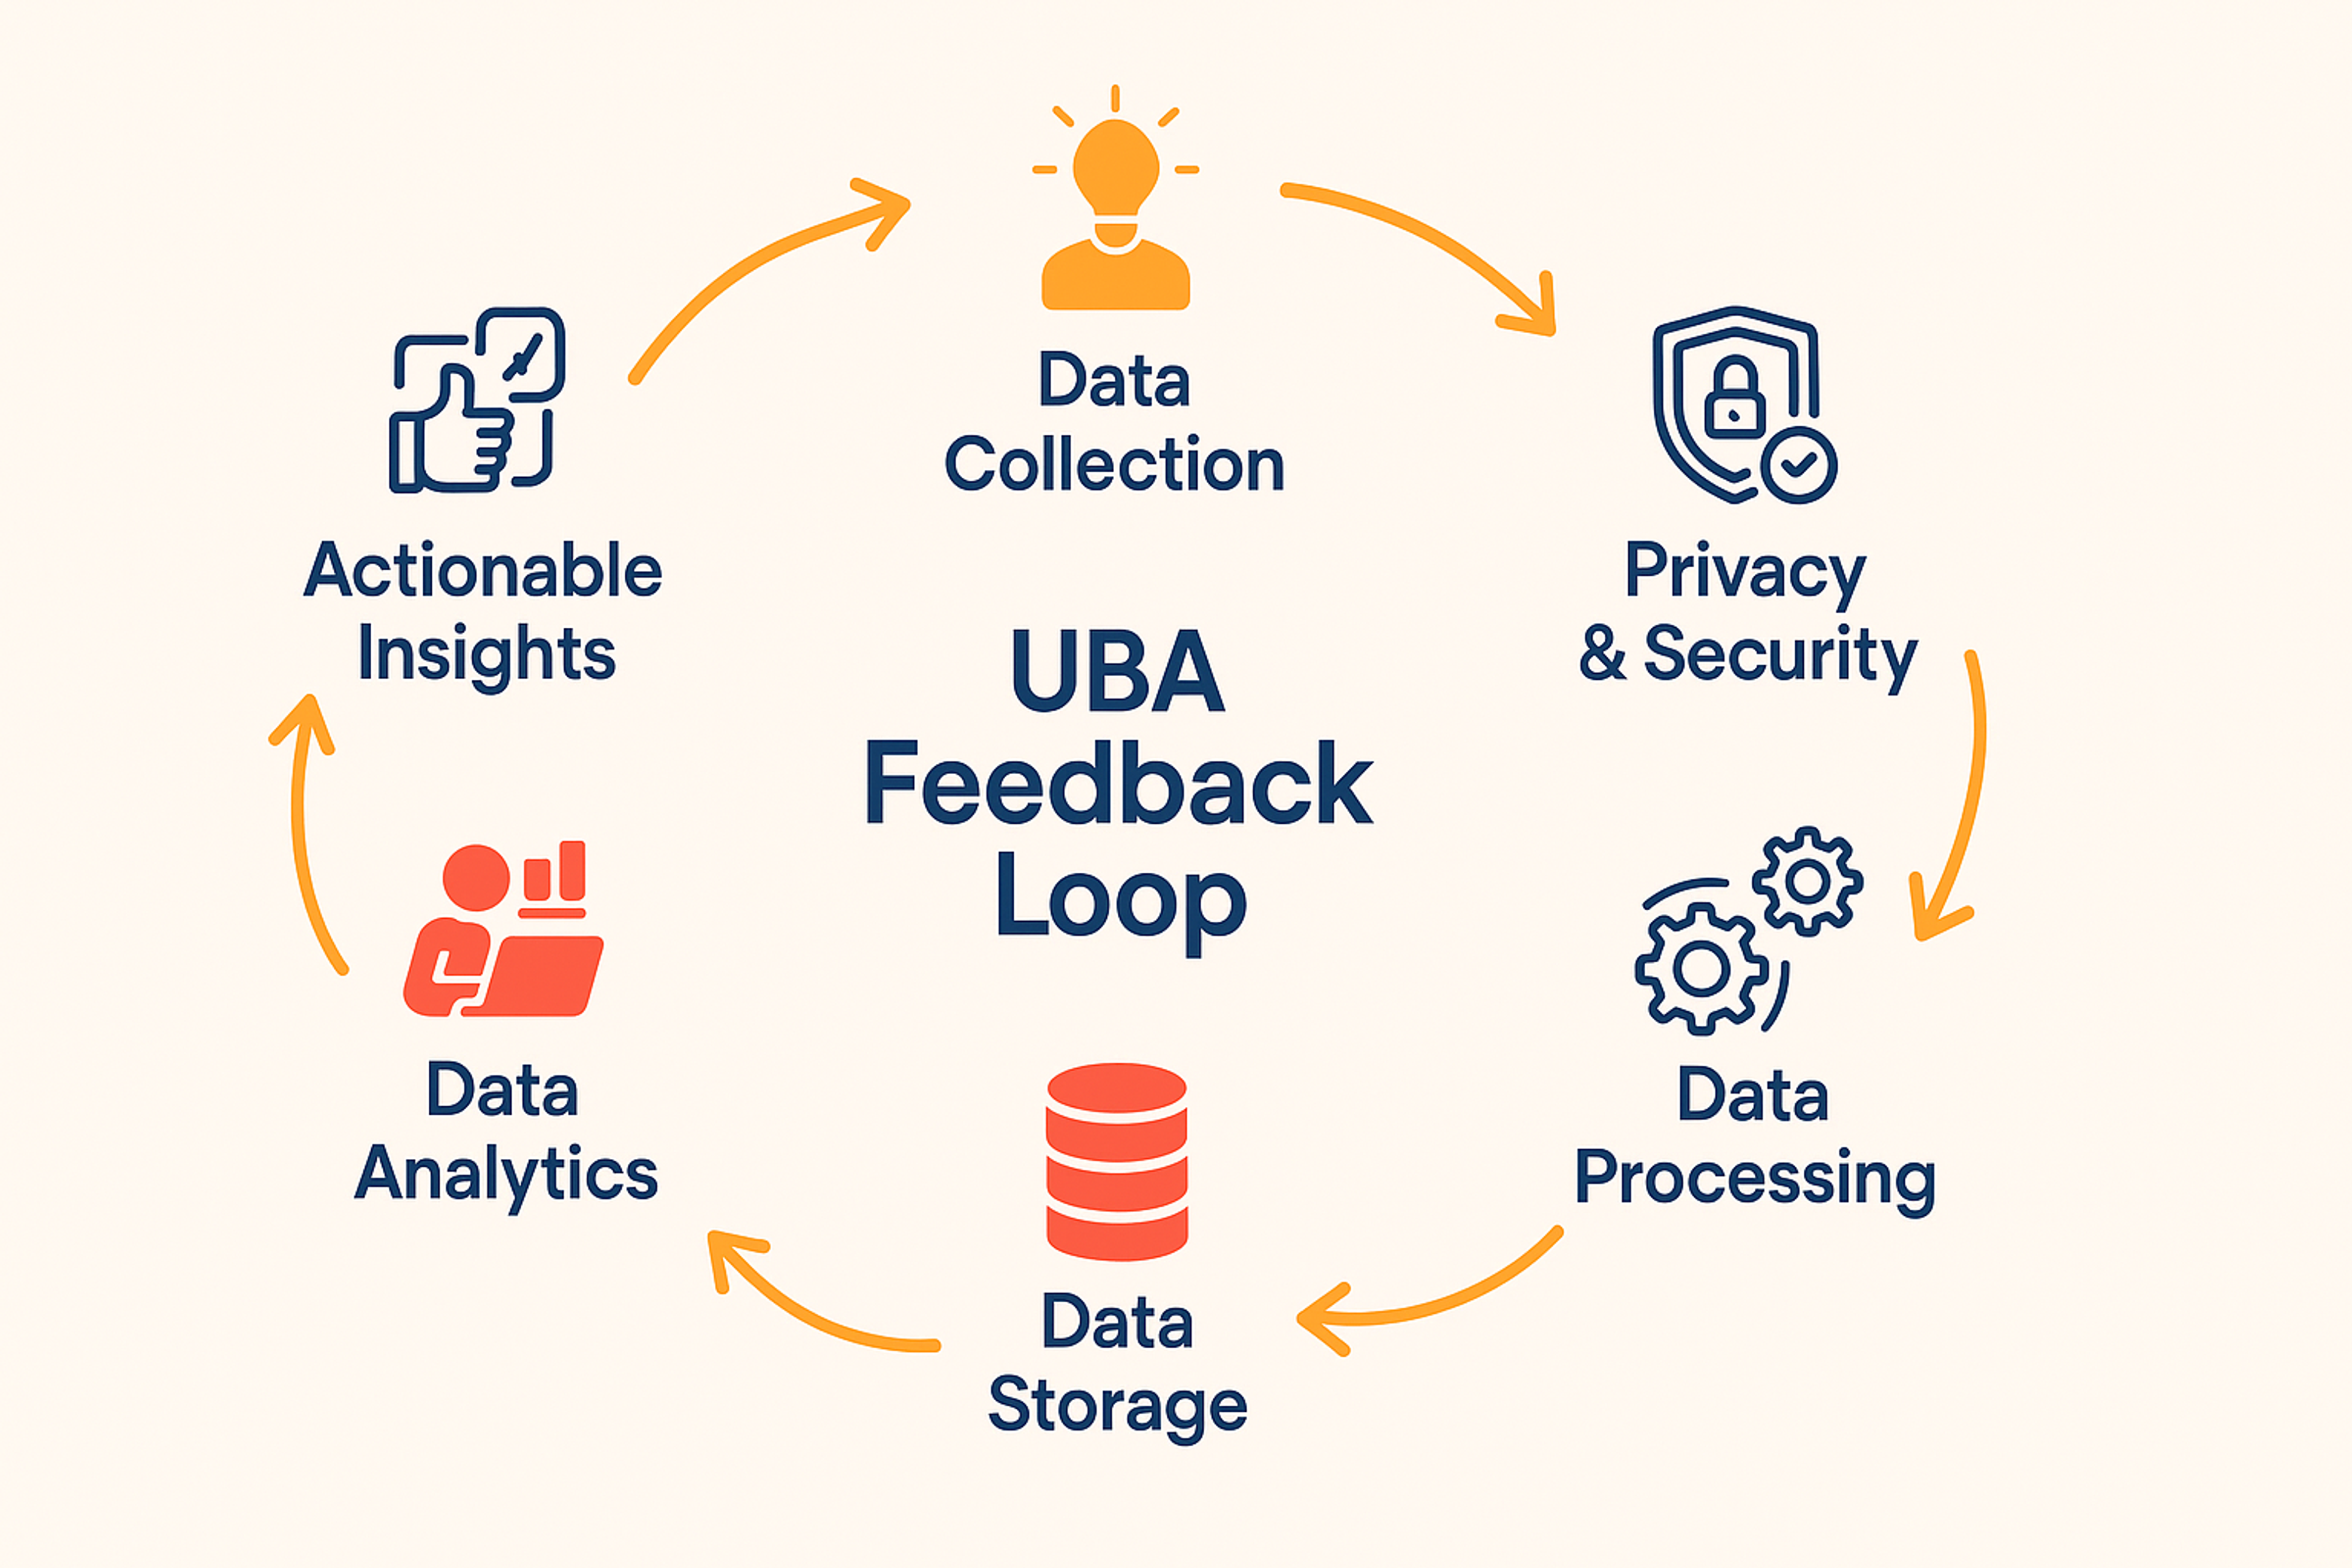
Act on Direct Feedback
User feedback eliminates assumptions. People tell you directly what works and what doesn't.
This raw input drives better design decisions. You build what users actually want instead of what you think they want.
Real feedback makes products more user-focused.
Optimizing User Experience
Improve Design and Usability
Optimization means refining interfaces based on behavioral insights. Address confusing navigation and unclear calls to action.
A/B testing compares design variations. You see which version performs better before committing to changes.
Data-driven decisions create intuitive interfaces. If testing shows users prefer simplified checkout, implement that change.
Implement Personalization
Behavioral tracking enables personalized experiences that boost engagement. Systems learn from past interactions to predict future needs.
Machine learning algorithms analyze behavior patterns and recommend relevant content. These systems improve as they process more interactions.
Consider the context, not only what users do but also when and where. Deliver the right message at the right moment.
E-commerce sites recommend products based on browsing history. Content platforms suggest articles matching user interests.
Understanding cognitive biases improves personalization effectiveness. People respond to certain prompts more than others.
Personalization makes users feel valued. They engage more deeply when experiences match their needs.
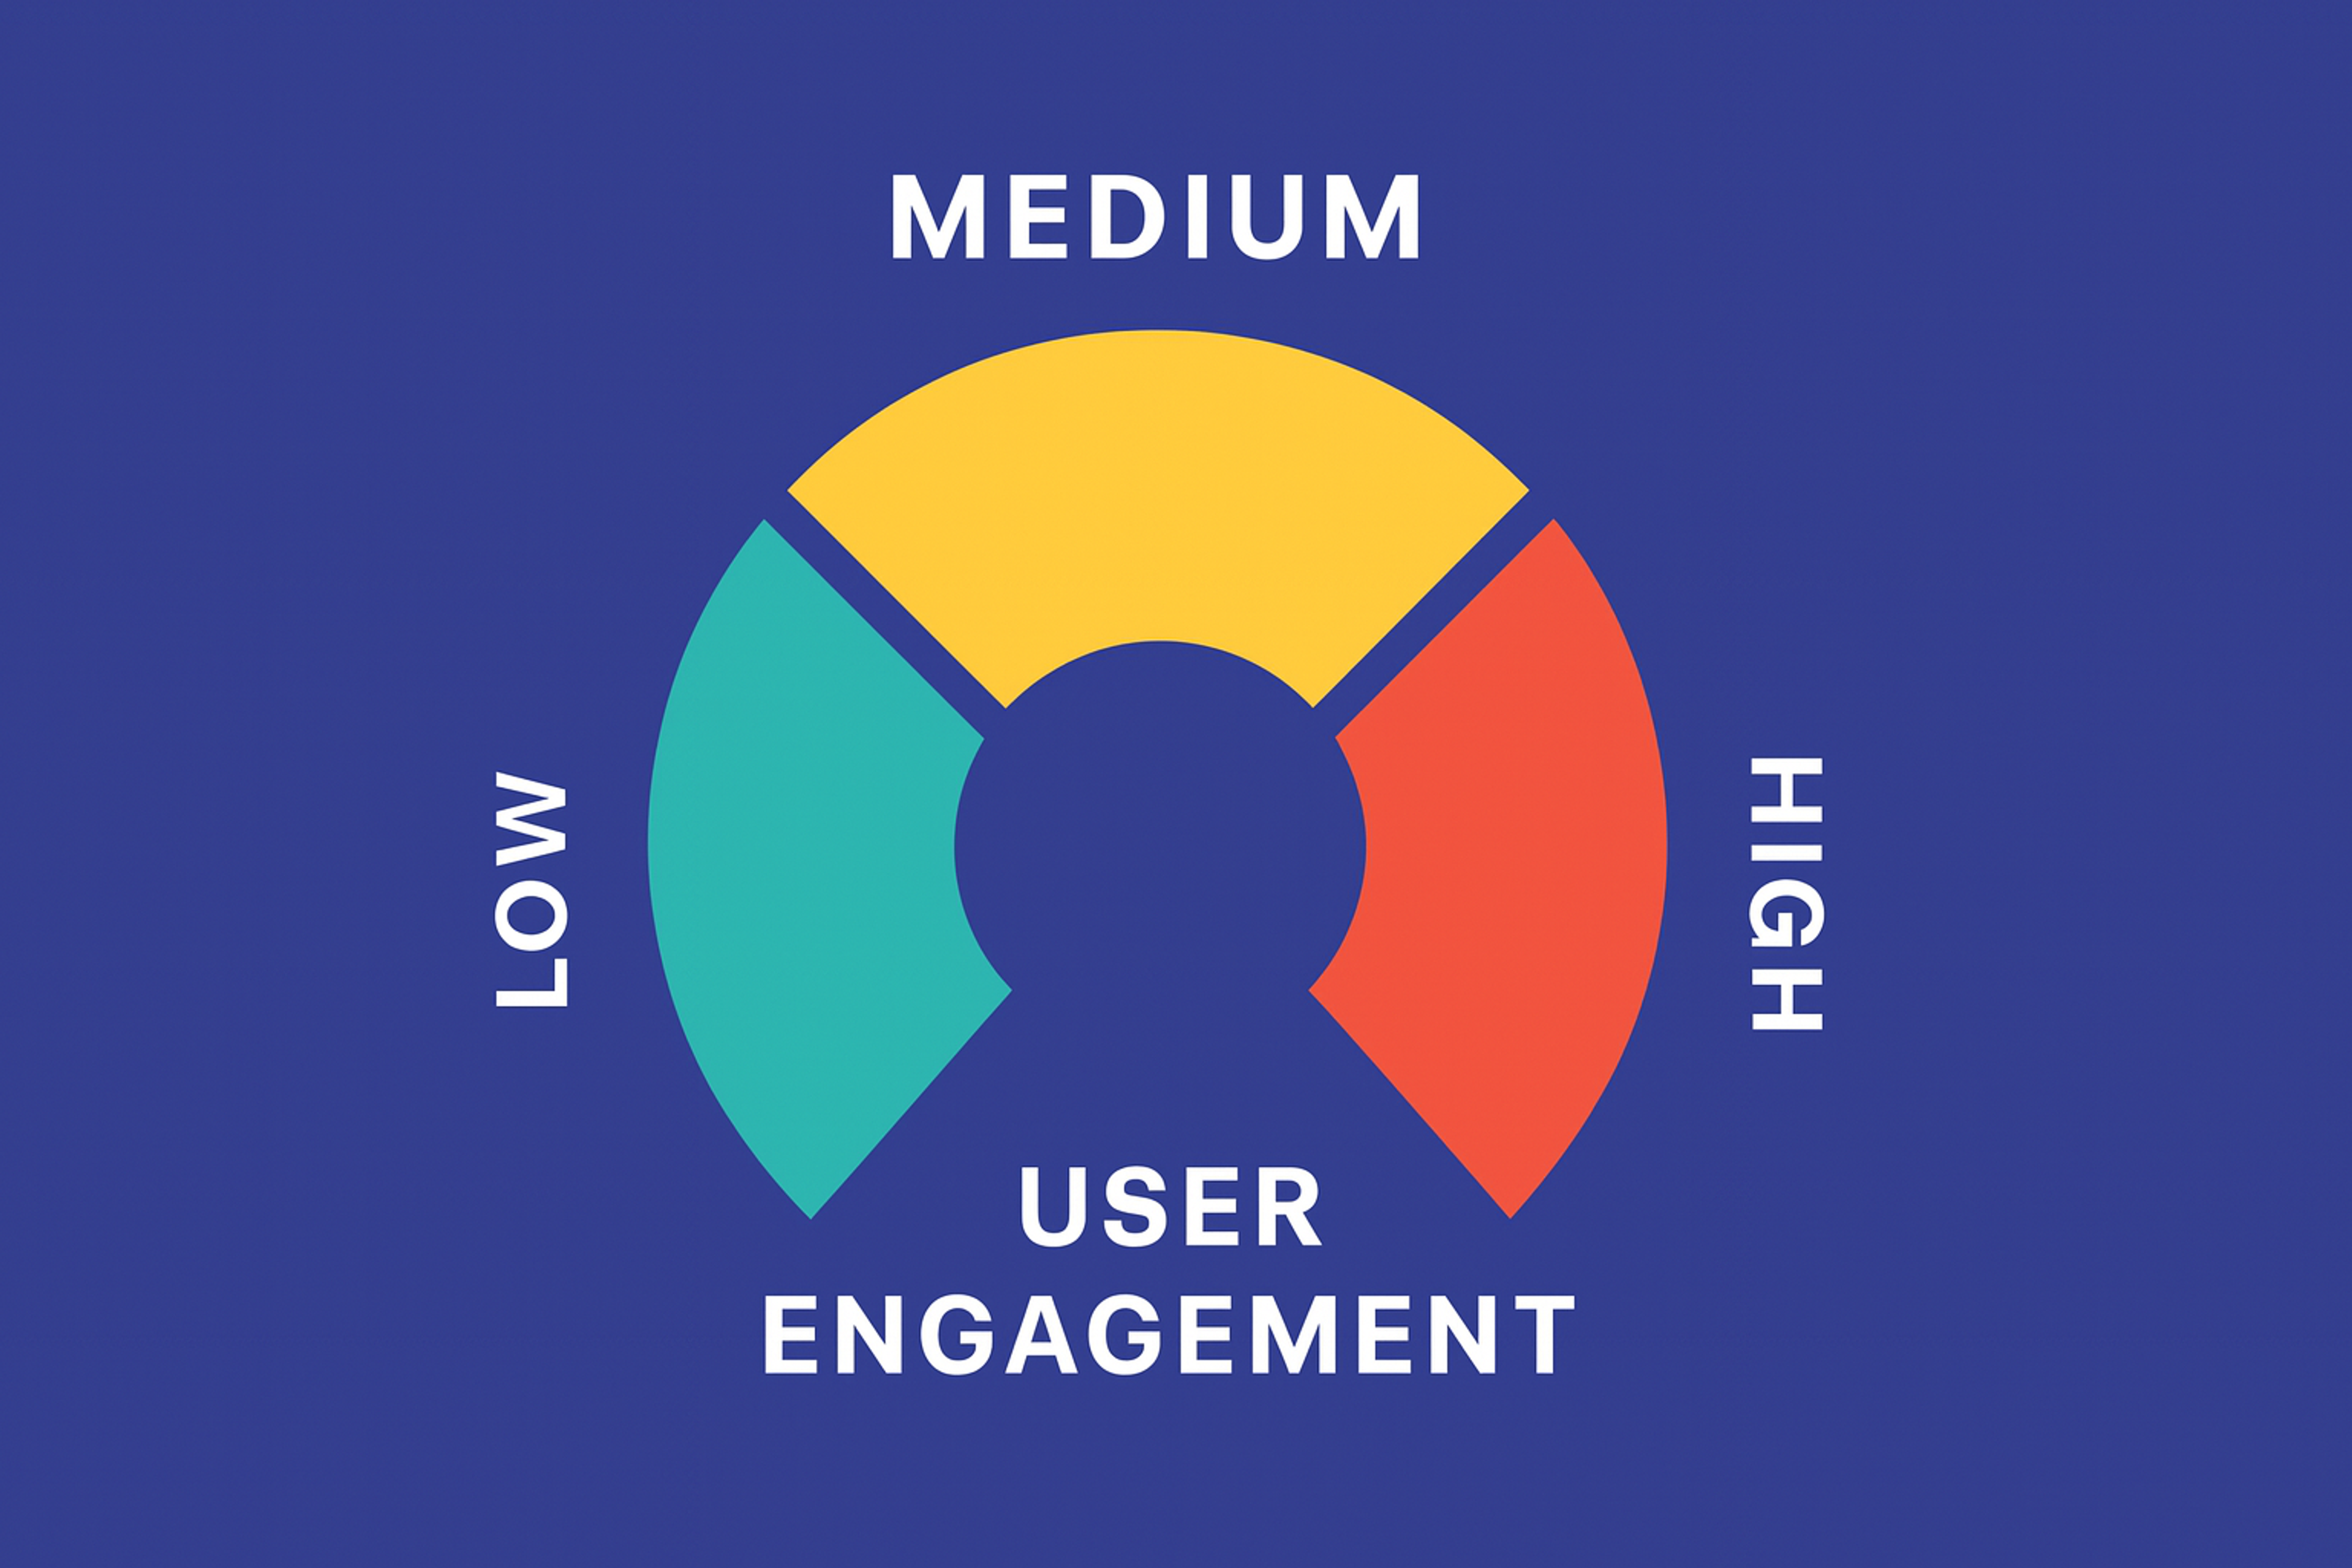
User Engagement Metrics
Driving Business Growth
Optimize Marketing and Sales
Click-through rates, page time, and conversion metrics reveal audience preferences. Monitoring page views helps track site traffic and user interest.
Use this data to customize marketing approaches. Target campaigns better, optimize messaging, and improve user experiences.
Platforms like HubSpot and Salesforce help gather and analyze user data. They automate processes and enable better decisions.
Guide Product Development
Feature popularity shows what users value most. Engagement data reveals which features succeed and which need work.
Daily and monthly active users provide clear pictures of product health. Feature adoption rates show whether new additions gain traction.
Tools like Productboard and JIRA monitor feature usage efficiently. They collect feedback and help build strategies aligned with user needs.
Advanced Analytics
Track Key Behavior Metrics
Behavior metrics show how users interact with digital products. Essential metrics include session duration, pages per visit, bounce rate, and conversion rate.
Engagement metrics like time on page reveal content quality. High bounce rates suggest unmet expectations.
Experience metrics measure how well products meet user needs. Task completion rates, error frequencies, and satisfaction scores matter most.
Behavioral flow metrics show user paths through sites and apps. These identify bottlenecks and optimization opportunities.
Retention metrics measure long-term engagement and loyalty. These directly impact revenue for subscription services.
Innovation in Analytics Tools
Modern tools provide deeper understanding of user activities. Combining analytics data with qualitative feedback leads to more comprehensive insights. They reveal popular elements, preferences, and improvement opportunities.
Real-time analysis enables immediate improvements. Teams respond quickly to challenges and align goals with user expectations.
Advanced platforms combine behavioral data with qualitative feedback. This reveals not just what users do, but why.
Tools like Fullstory and UserTesting lead the technology. Fullstory uses session replays to identify friction points. UserTesting collects feedback for experience improvements.
Interaction heatmapping shows detailed behavior visualiz
FAQ
What Is the Difference Between UEBA and UBA?
UBA (User Behavior Analytics) analyzes only user activity to spot anomalies like unusual logins, risky access patterns, or abnormal data downloads.
UEBA (User and Entity Behavior Analytics) covers the same user behavior, plus entities such as devices, servers, service accounts, applications, and IoT endpoints. It correlates activity across users and these entities to detect threats like lateral movement or suspicious service account behavior.
What Is an Example of User Behaviour?
User behaviour is any action a person (or machine account) takes in a system. Examples: logging in from a new country at 3 a.m., downloading thousands of files in minutes, repeatedly failing MFA, or creating unusual API keys.
On the positive side, it can also be standard patterns like logging in from the same laptop every weekday and accessing the same few apps.
What Is UEBA and How Does It Work?
UEBA (User and Entity Behavior Analytics) is a security approach that learns what “normal” looks like for users and devices and flags risky deviations. It pulls signals from identity systems, endpoints, apps, and networks, builds baselines, and uses statistics, machine learning, and rule logic to detect anomalies.
UEBA assigns risk scores, correlates events across sources, and sends prioritized alerts to your SIEM/SOAR so teams can investigate or auto-respond.
What’s the Difference Between User Behaviour and UX?
User behaviour is what people actually do: clicks, paths, errors, time on task, downloads, etc.
UX (User Experience) is the overall quality of the interaction: clarity, ease, delight, and whether users achieve their goals.
Behaviour is evidence. UX is the outcome/design discipline that uses that evidence to improve the product.
What Is the Difference Between UEBA and IAM?
IAM (Identity and Access Management) controls who can do what: authentication, authorization, provisioning, MFA, and policy enforcement.
UEBA monitors what identities and devices actually do and looks for suspicious or abnormal activity.
In short, IAM prevents the wrong access; UEBA detects when “right” access is used in the wrong way.
Read more:
Conclusion
Understanding user behavior is essential for building successful digital products. User analytics and user behavior data are foundational for continuous improvement. Behavioral analytics creates countless improvement opportunities, leading to better experiences and stronger results.
Whether through data analysis or direct feedback, behavioral insights ensure products develop according to actual user needs. This approach drives sustainable success and meaningful user relationships.

About Clay
Clay is a UI/UX design & branding agency in San Francisco. We team up with startups and leading brands to create transformative digital experience. Clients: Facebook, Slack, Google, Amazon, Credit Karma, Zenefits, etc.
Learn moreAbout Clay
Clay is a UI/UX design & branding agency in San Francisco. We team up with startups and leading brands to create transformative digital experience. Clients: Facebook, Slack, Google, Amazon, Credit Karma, Zenefits, etc.
Learn more