Most customer journey maps get built once, presented once, and then forgotten in a shared drive. The exercise itself isn't the problem. Most teams just skip the part that actually makes a map useful: turning raw research into a structure someone can act on.
Think of a journey map as evidence for a decision, not a deliverable to file away. A good one tells your team where users get stuck, why they leave, and which fix matters more than the other nine on your backlog.
A bad one hangs around as a diagram nobody opens again after the kickoff meeting.
Key Takeaways
- A journey map only earns its keep if it changes a decision. If nobody can point to a choice it influenced, it's decoration.
- The hardest part isn't gathering research, but rather synthesizing it into stages and moments that actually reflect what users experience.
- Get a stakeholder from outside design in the room before you start mapping, not after you present it.
- Match the map type to the job: current-state for fixing what's broken, future-state for planning what's next.
- Maps decay fast. Assign an owner and a review cadence, or the map you build this quarter is wrong by next quarter.
What Is a Customer Journey Map?
A customer journey map is a visual record of what a user does, thinks, and feels as they move through every interaction with your product or brand, from first contact to long after purchase.
It's built from research, not guesswork, and surfaces the gap between what your team assumes happens and what actually happens.
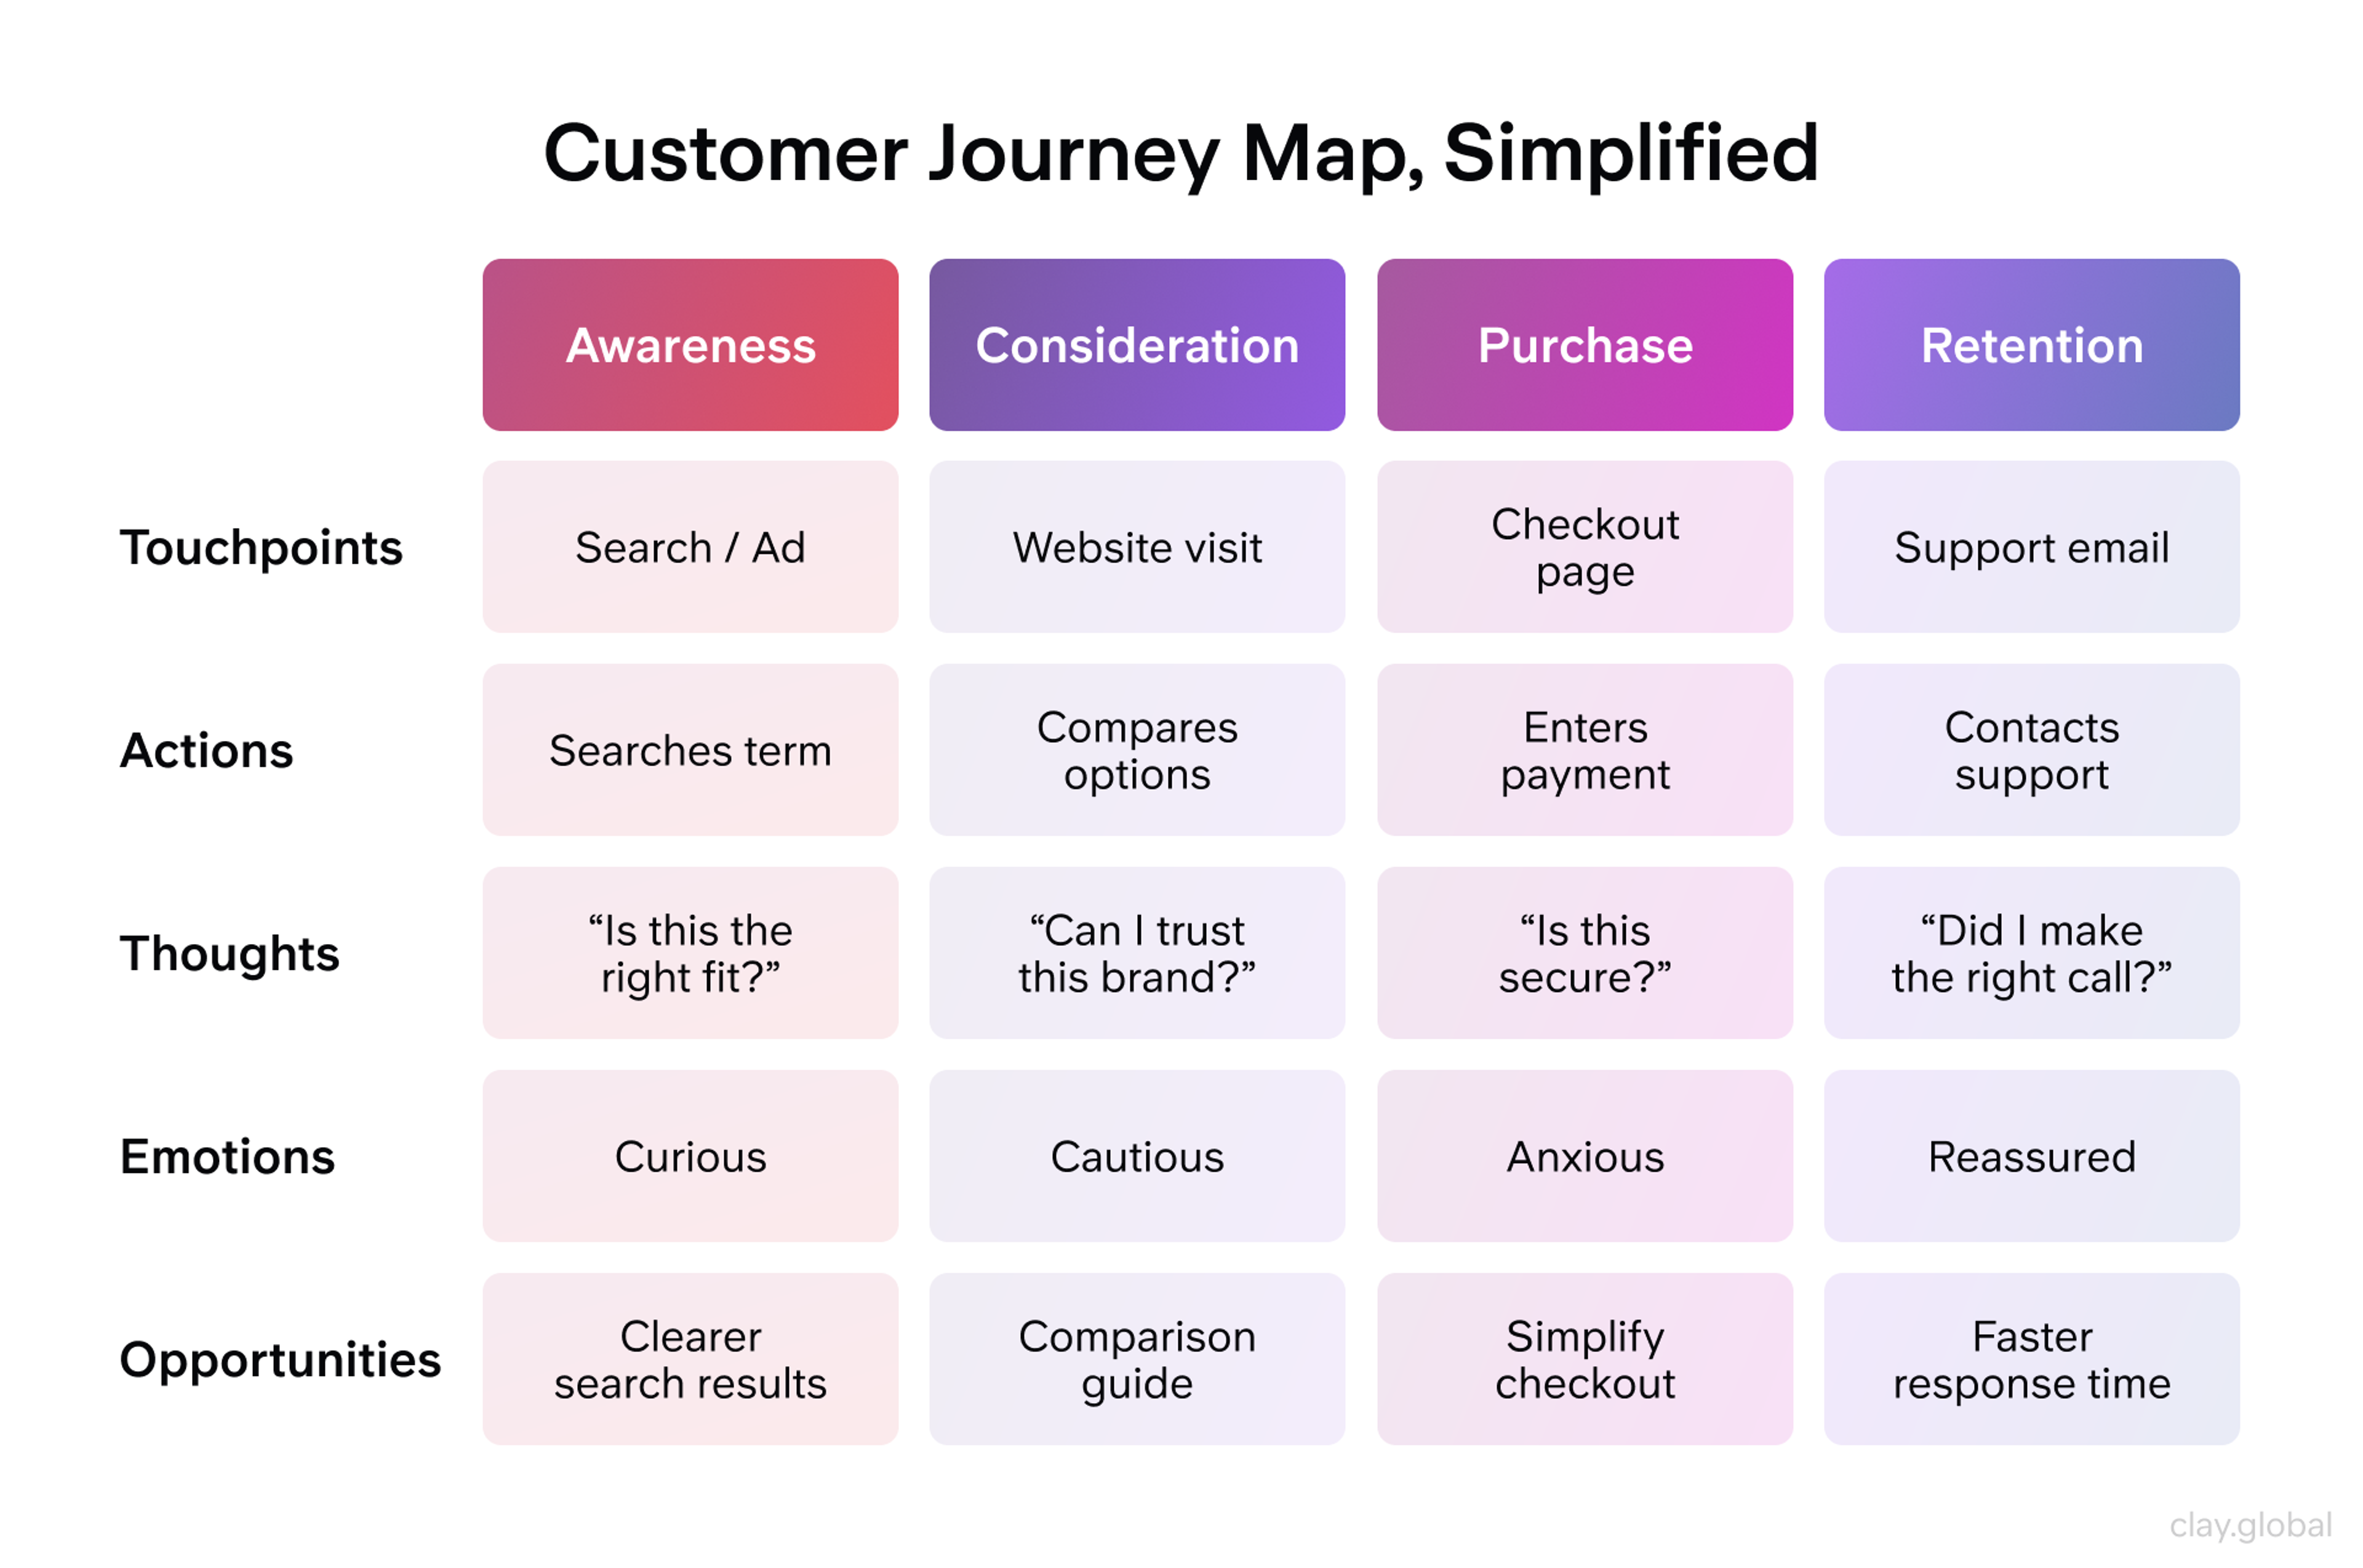
Every map, regardless of format, tracks the same core elements:
- Touchpoints: the specific moments a user interacts with you, a website visit, an app open, a support call.
- Personas: the 2-3 user types the map represents, built from real interviews and behavioral data, not internal assumptions.
- Stages: the phases a user moves through, typically awareness, consideration, purchase, and retention.
- Emotions: how the user feels at each touchpoint, mapped alongside their actions, not as an afterthought.
- Actions: what the user actually does: click, scroll, call, abandon.
- Opportunities: the specific moments where a change would reduce friction or add value.
What Is a Customer Journey Map? by Clay
Miss any one of these and the map stops being useful. A journey map with touchpoints but no emotional data tells you where users are, not why they're struggling.
Why Journey Mapping Matters
Companies that lead on customer experience grow revenue 4-8% above their market, according to Bain & Company's analysis of customer experience leaders. Journey mapping is one of the few tools that gets an entire team involved, not just the design one. It looks at the same evidence about where that growth is being lost.
Hanover Research's 2026 survey of businesses using journey maps found that 76% say the practice increased ROI on their customer experience investments, and roughly 47% of companies now use journey maps specifically to manage complex, multi-channel buyer experiences.
Why Journey Mapping Matters by Clay
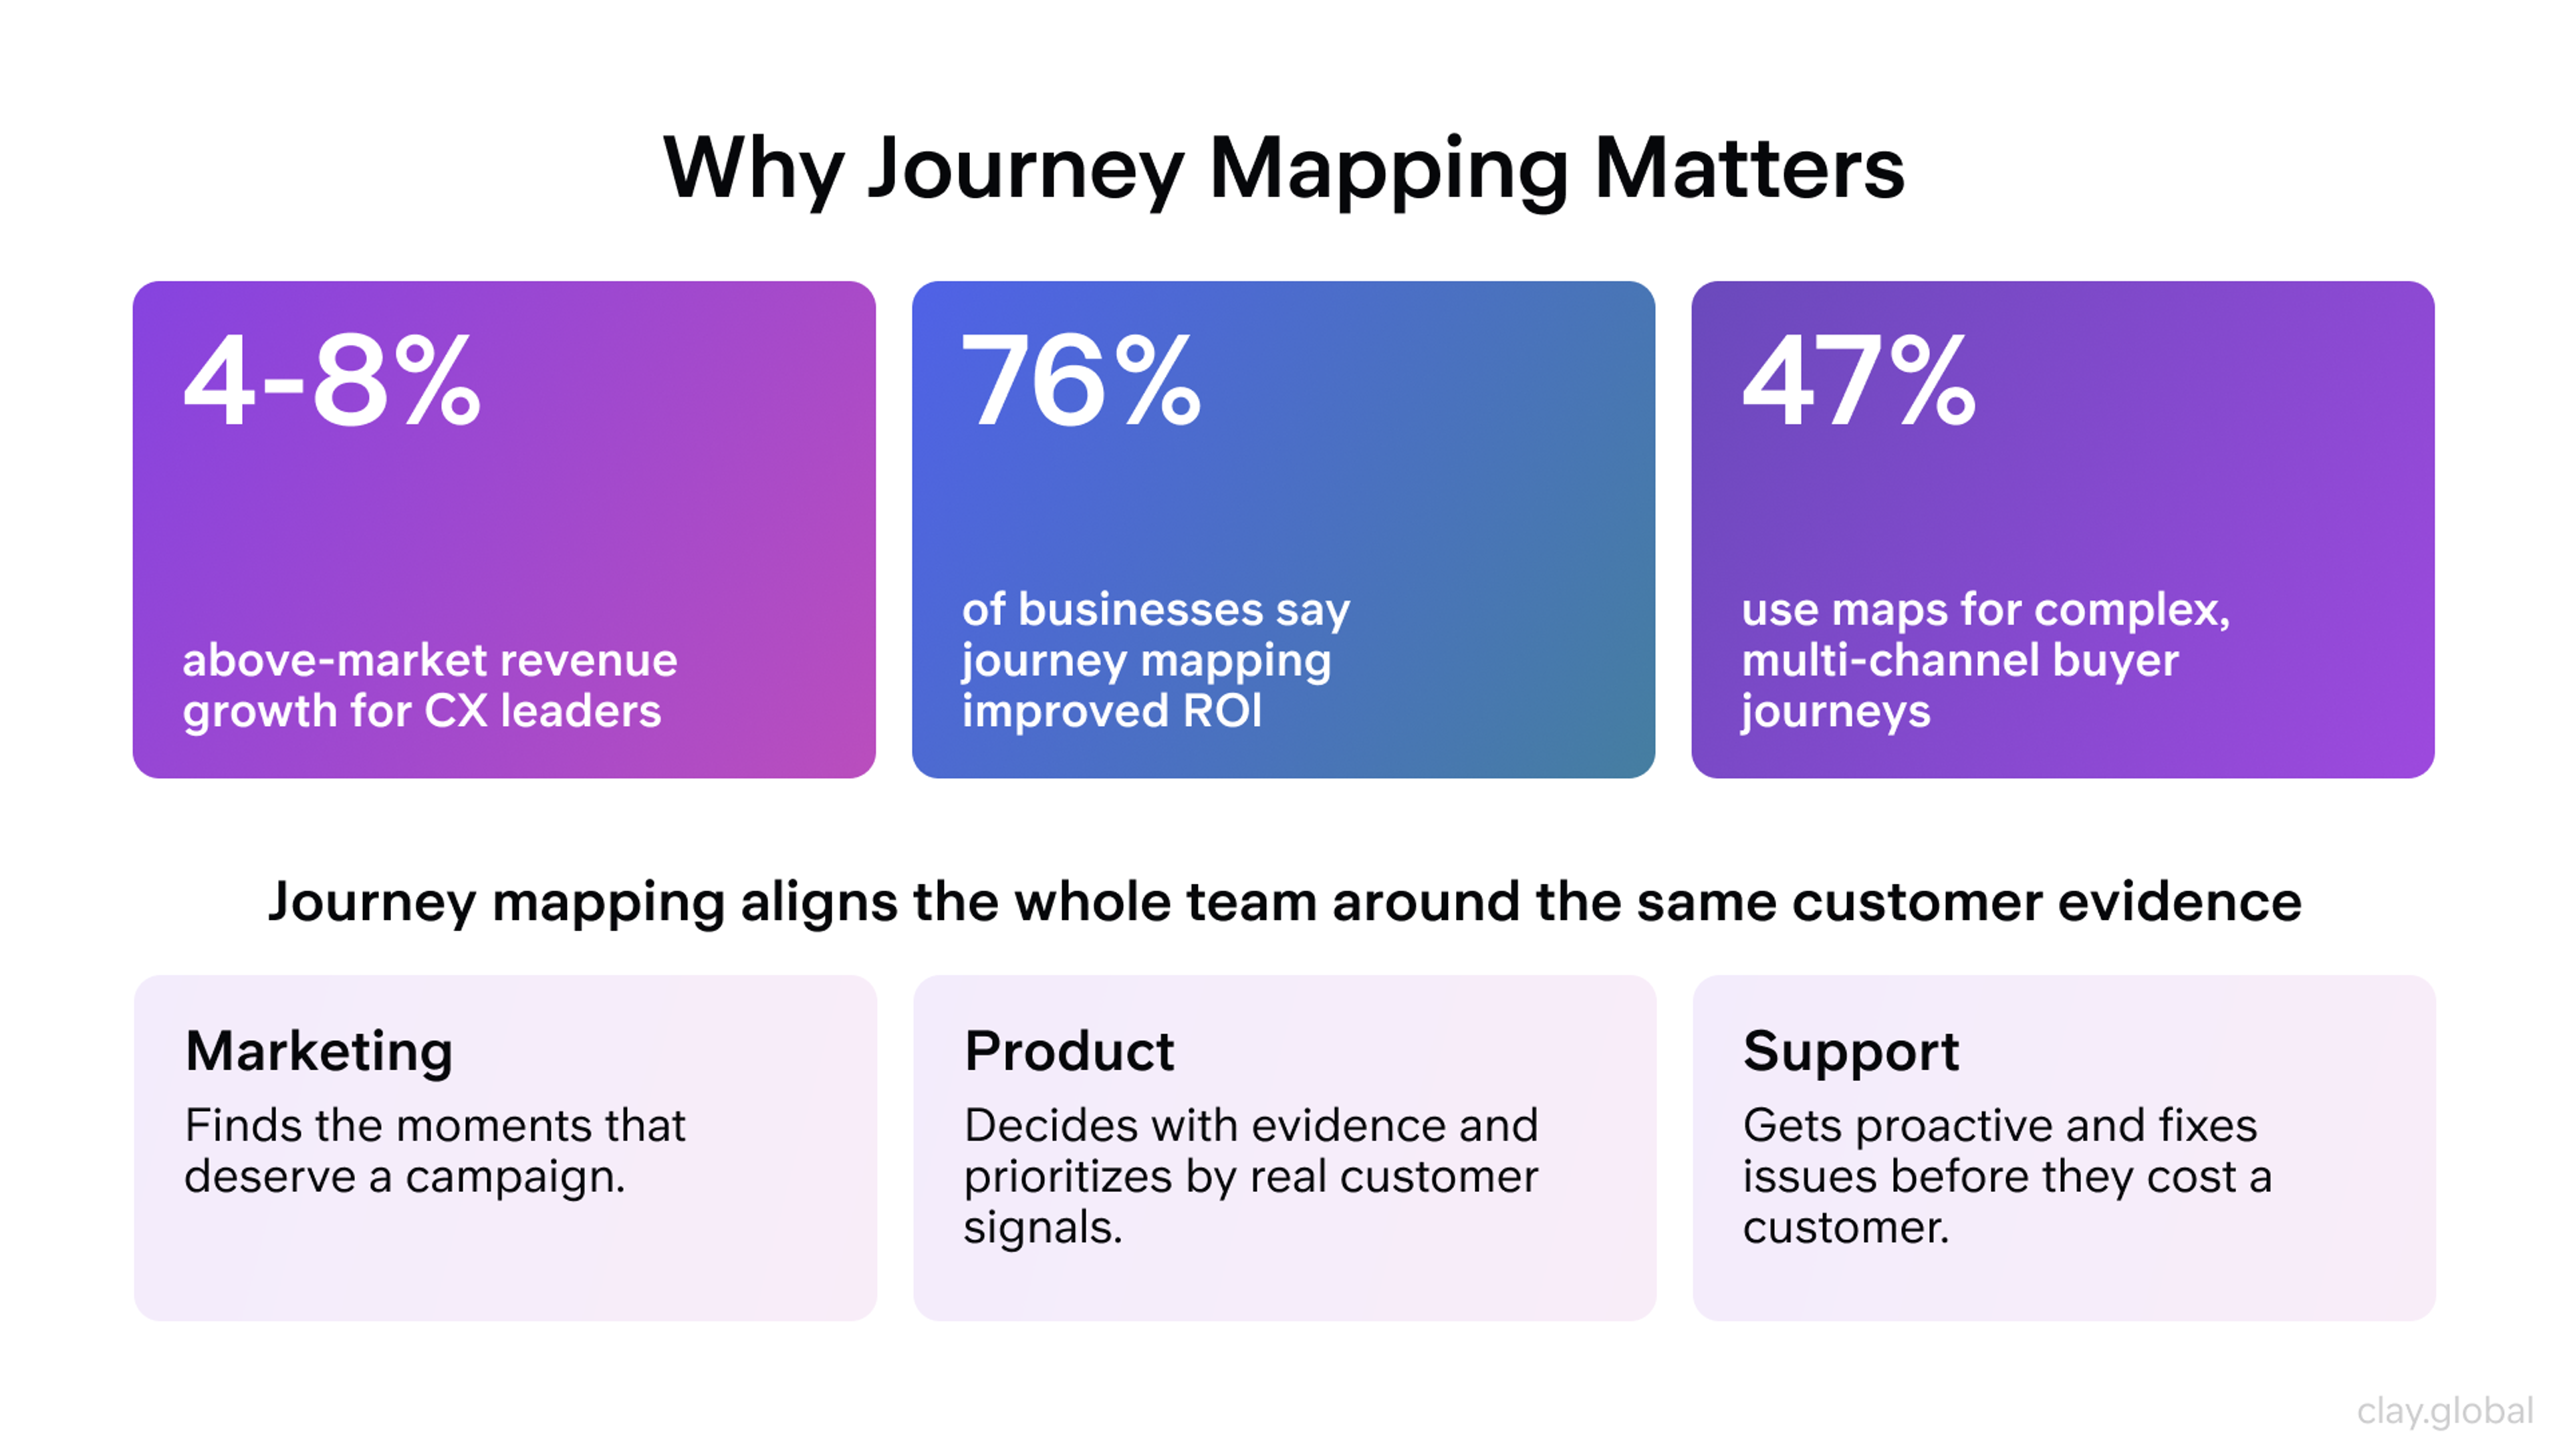
That's a vendor survey, so treat the specific numbers as directional, but the pattern holds across independent research too: marketing stops guessing which moments deserve a campaign, product teams stop debating features based on opinion, and support starts anticipating problems instead of reacting after they've already cost you a customer.
How UX Designers Use Journey Maps
Designers don't treat journey maps as a one-time artifact. They're more of a working reference, pulled up in sprint planning and revisited whenever a feature decision needs a gut check against real user behavior.
The map earns its place in three moments:
1.
During discovery, a designer cross-references it against Google Analytics flow reports or Hotjar heatmaps to confirm where users actually drop off, not where the team assumes they do.2.
During validation, Mixpanel event data or a round of usability testing confirms whether a shipped feature actually resolved the friction the map flagged.3.
In cross-functional reviews, the map gives engineering, marketing, and support a shared reference point instead of three different mental models of the same user.
Used this way, a journey map keeps decisions tied to observed behavior instead of internal debate. A map nobody consults after week one isn't doing that job.
Types of Customer Journey Maps
Not every mapping project needs the same format. The type you choose should match the decision you're trying to support.
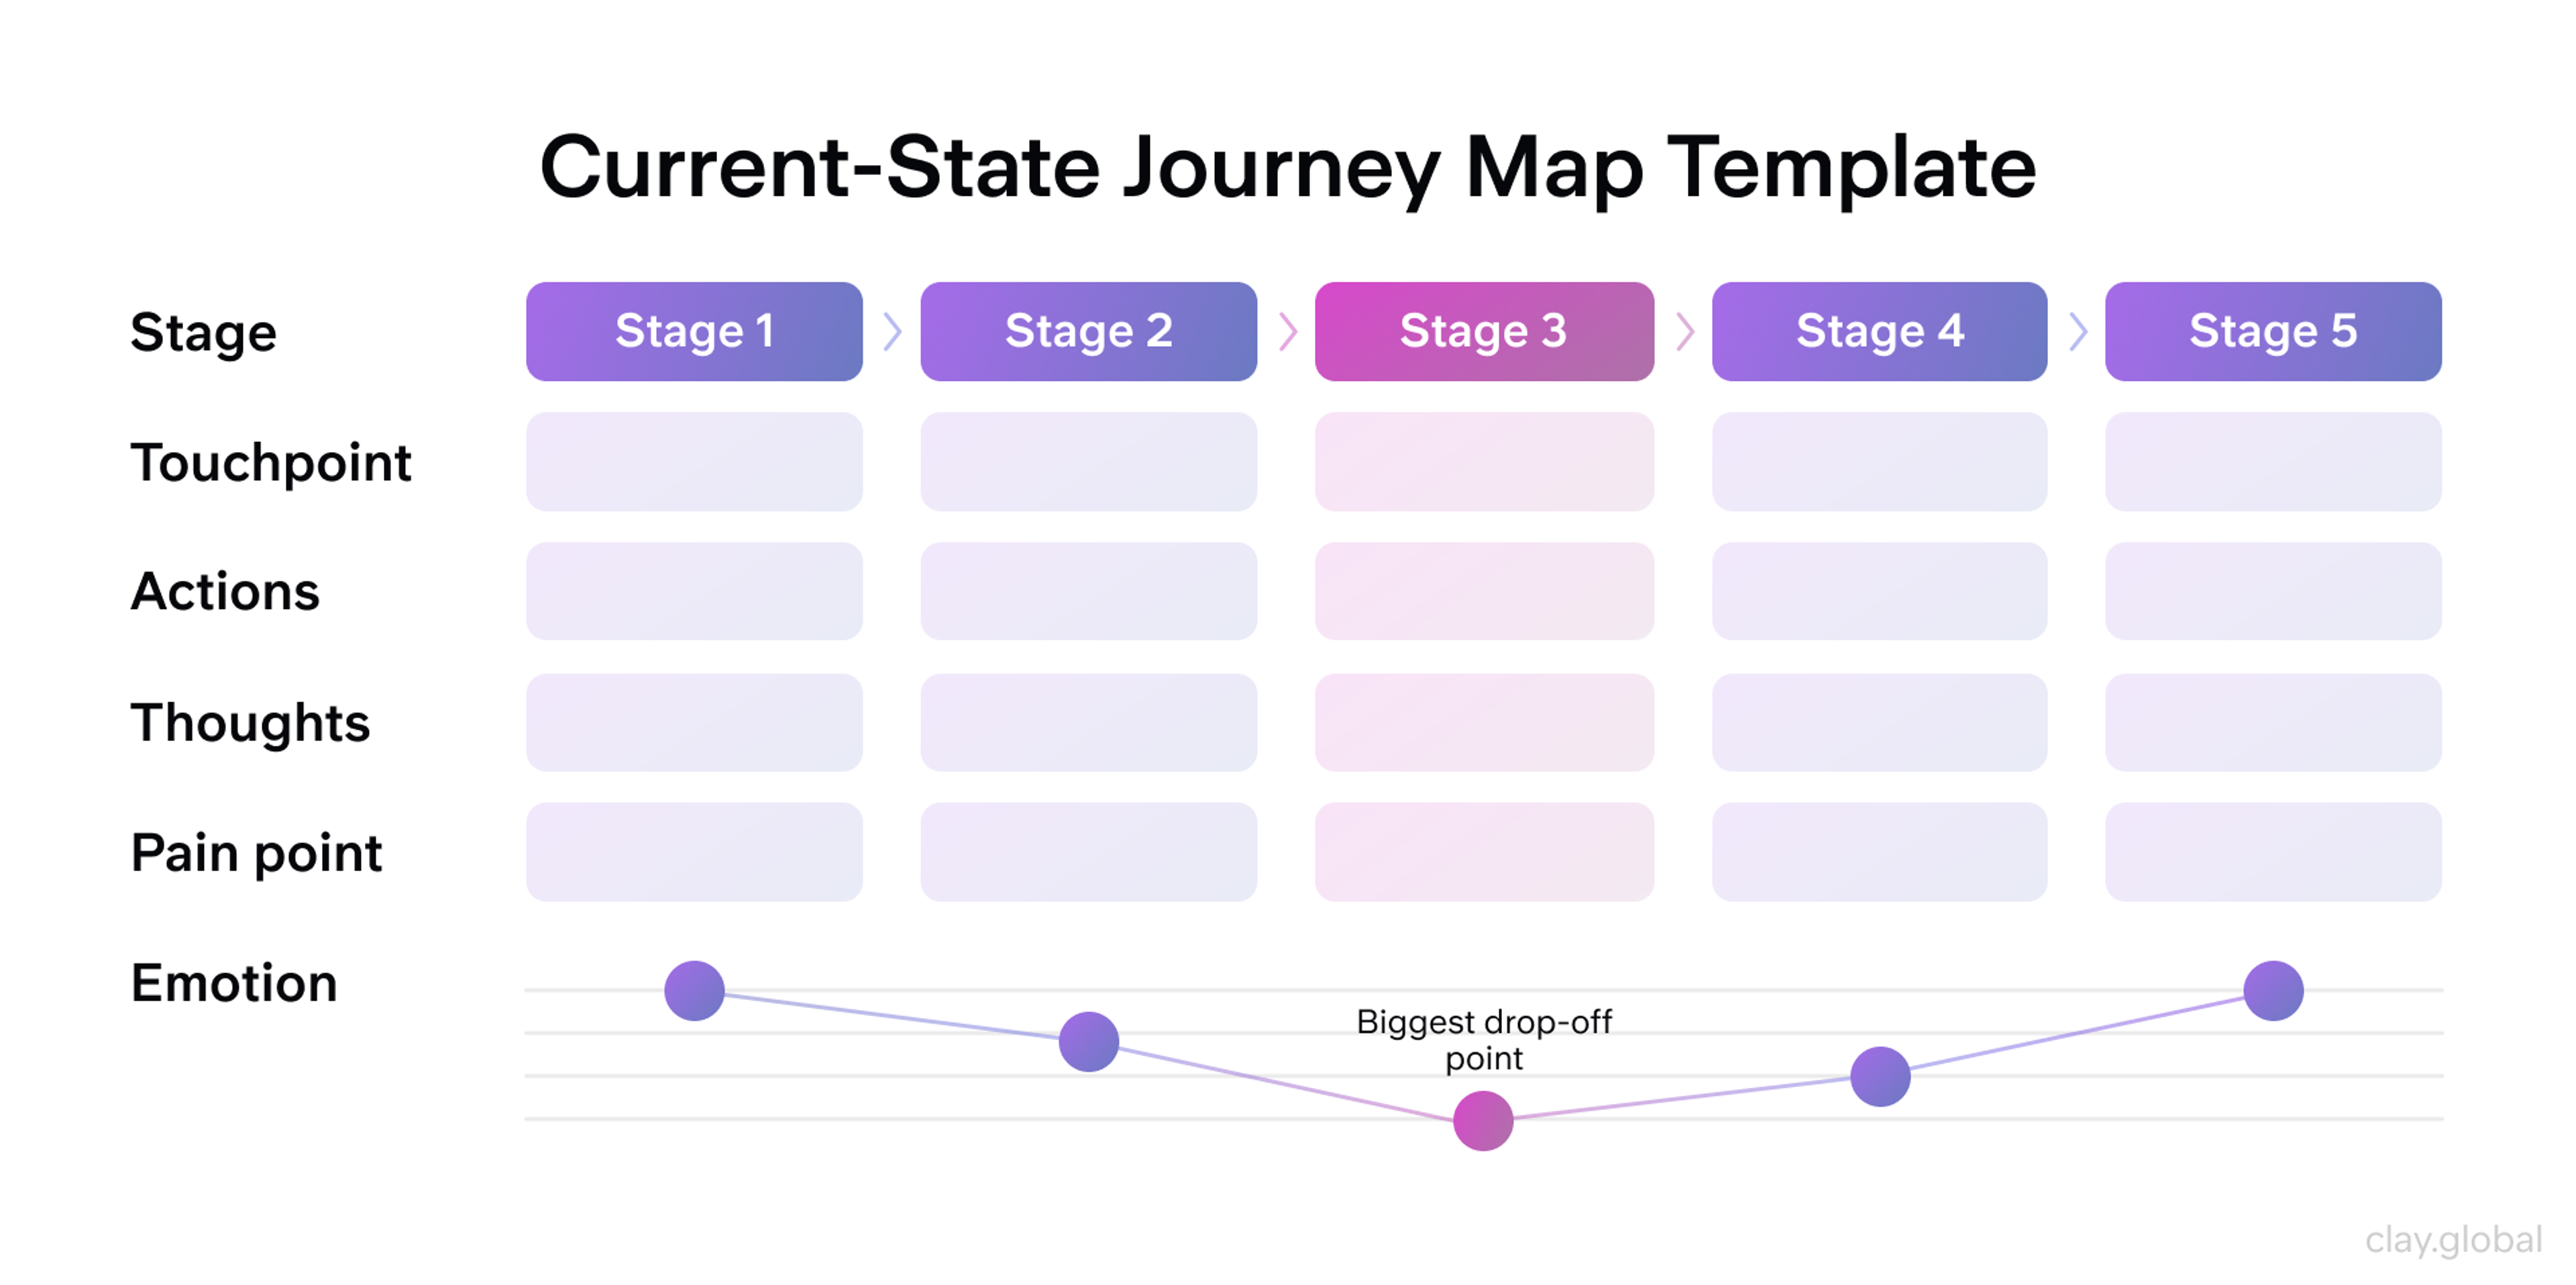
Current-state maps document how users interact with your product today, imperfections included. They're built from real behavioral data and existing user feedback, and they're the right choice when you need to find quick wins or onboard a new team member to what's actually happening versus what the roadmap assumes.
The tradeoff: they can get overloaded with detail and skew toward documenting problems rather than solutions.
Current-State Map Template by Clay
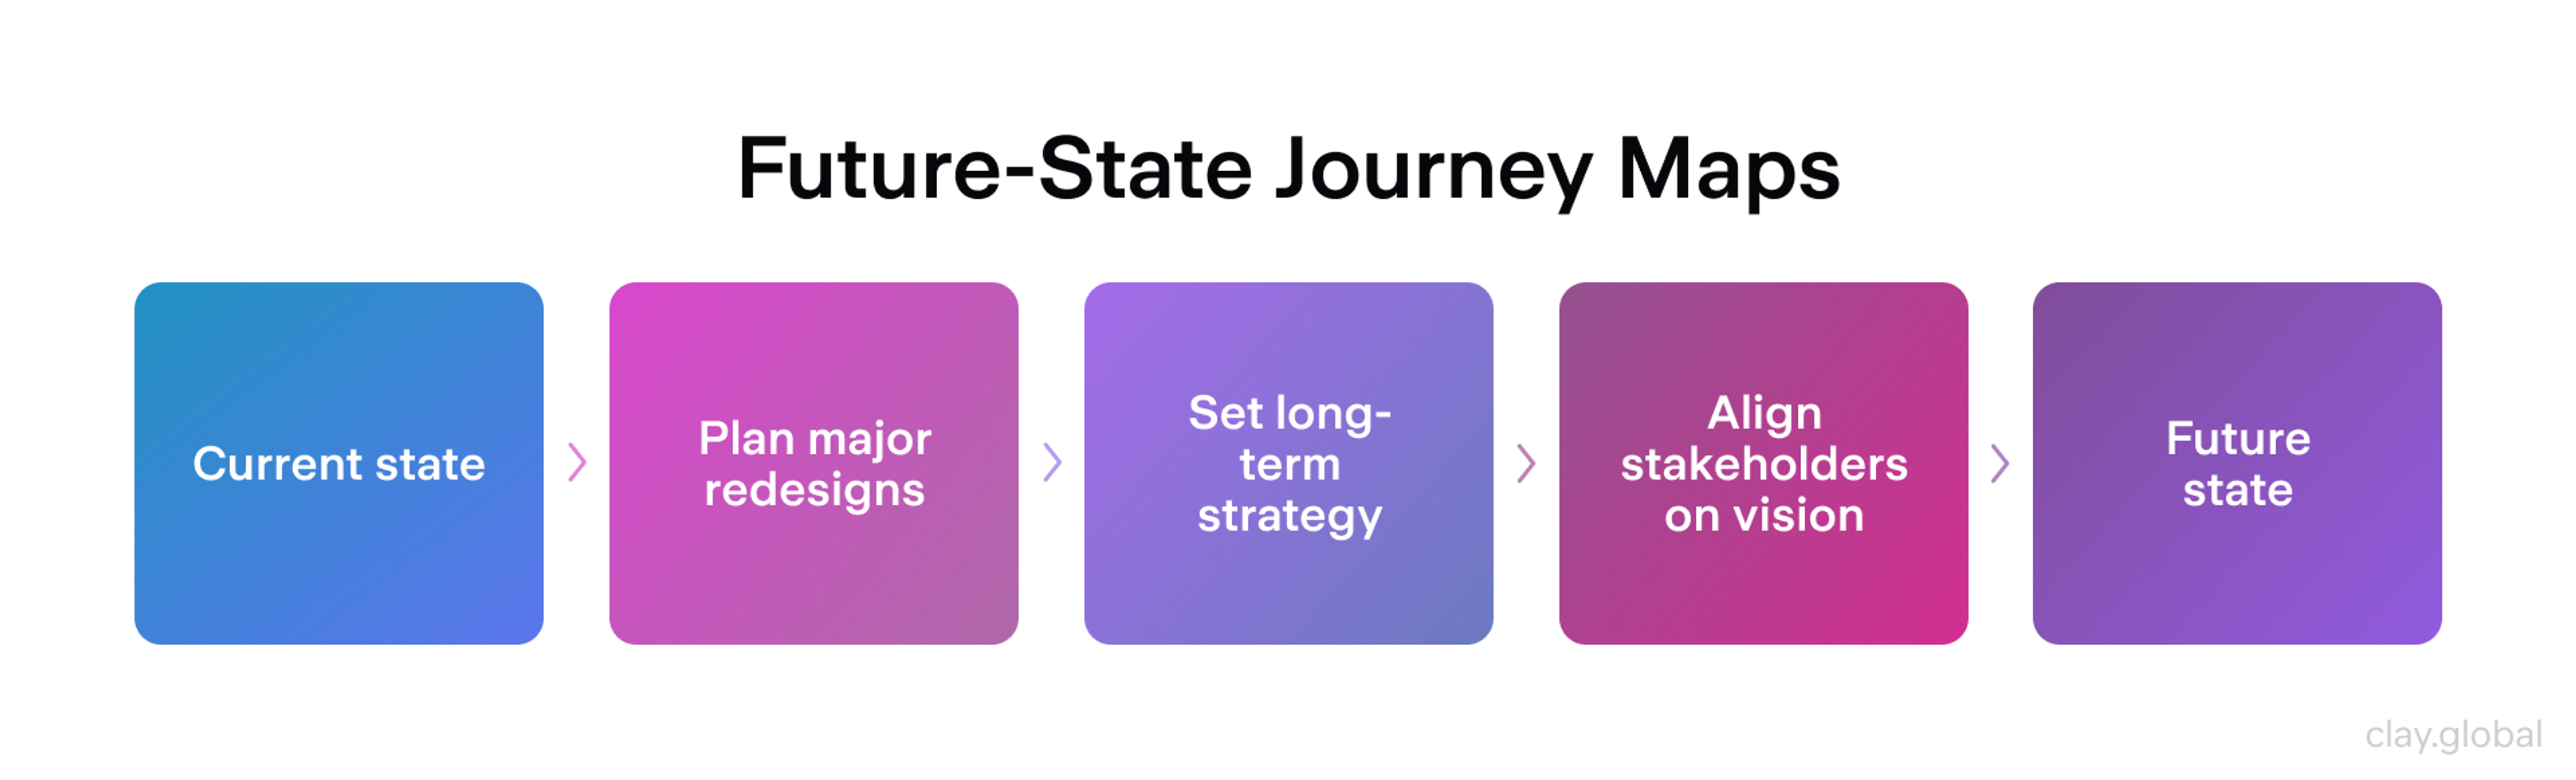
Future-state maps envision the experience you're building toward. Use these for major redesigns, long-term product strategy, or communicating a vision to stakeholders who need to see where the roadmap is headed before you build it.
Future-State Map Template by Clay
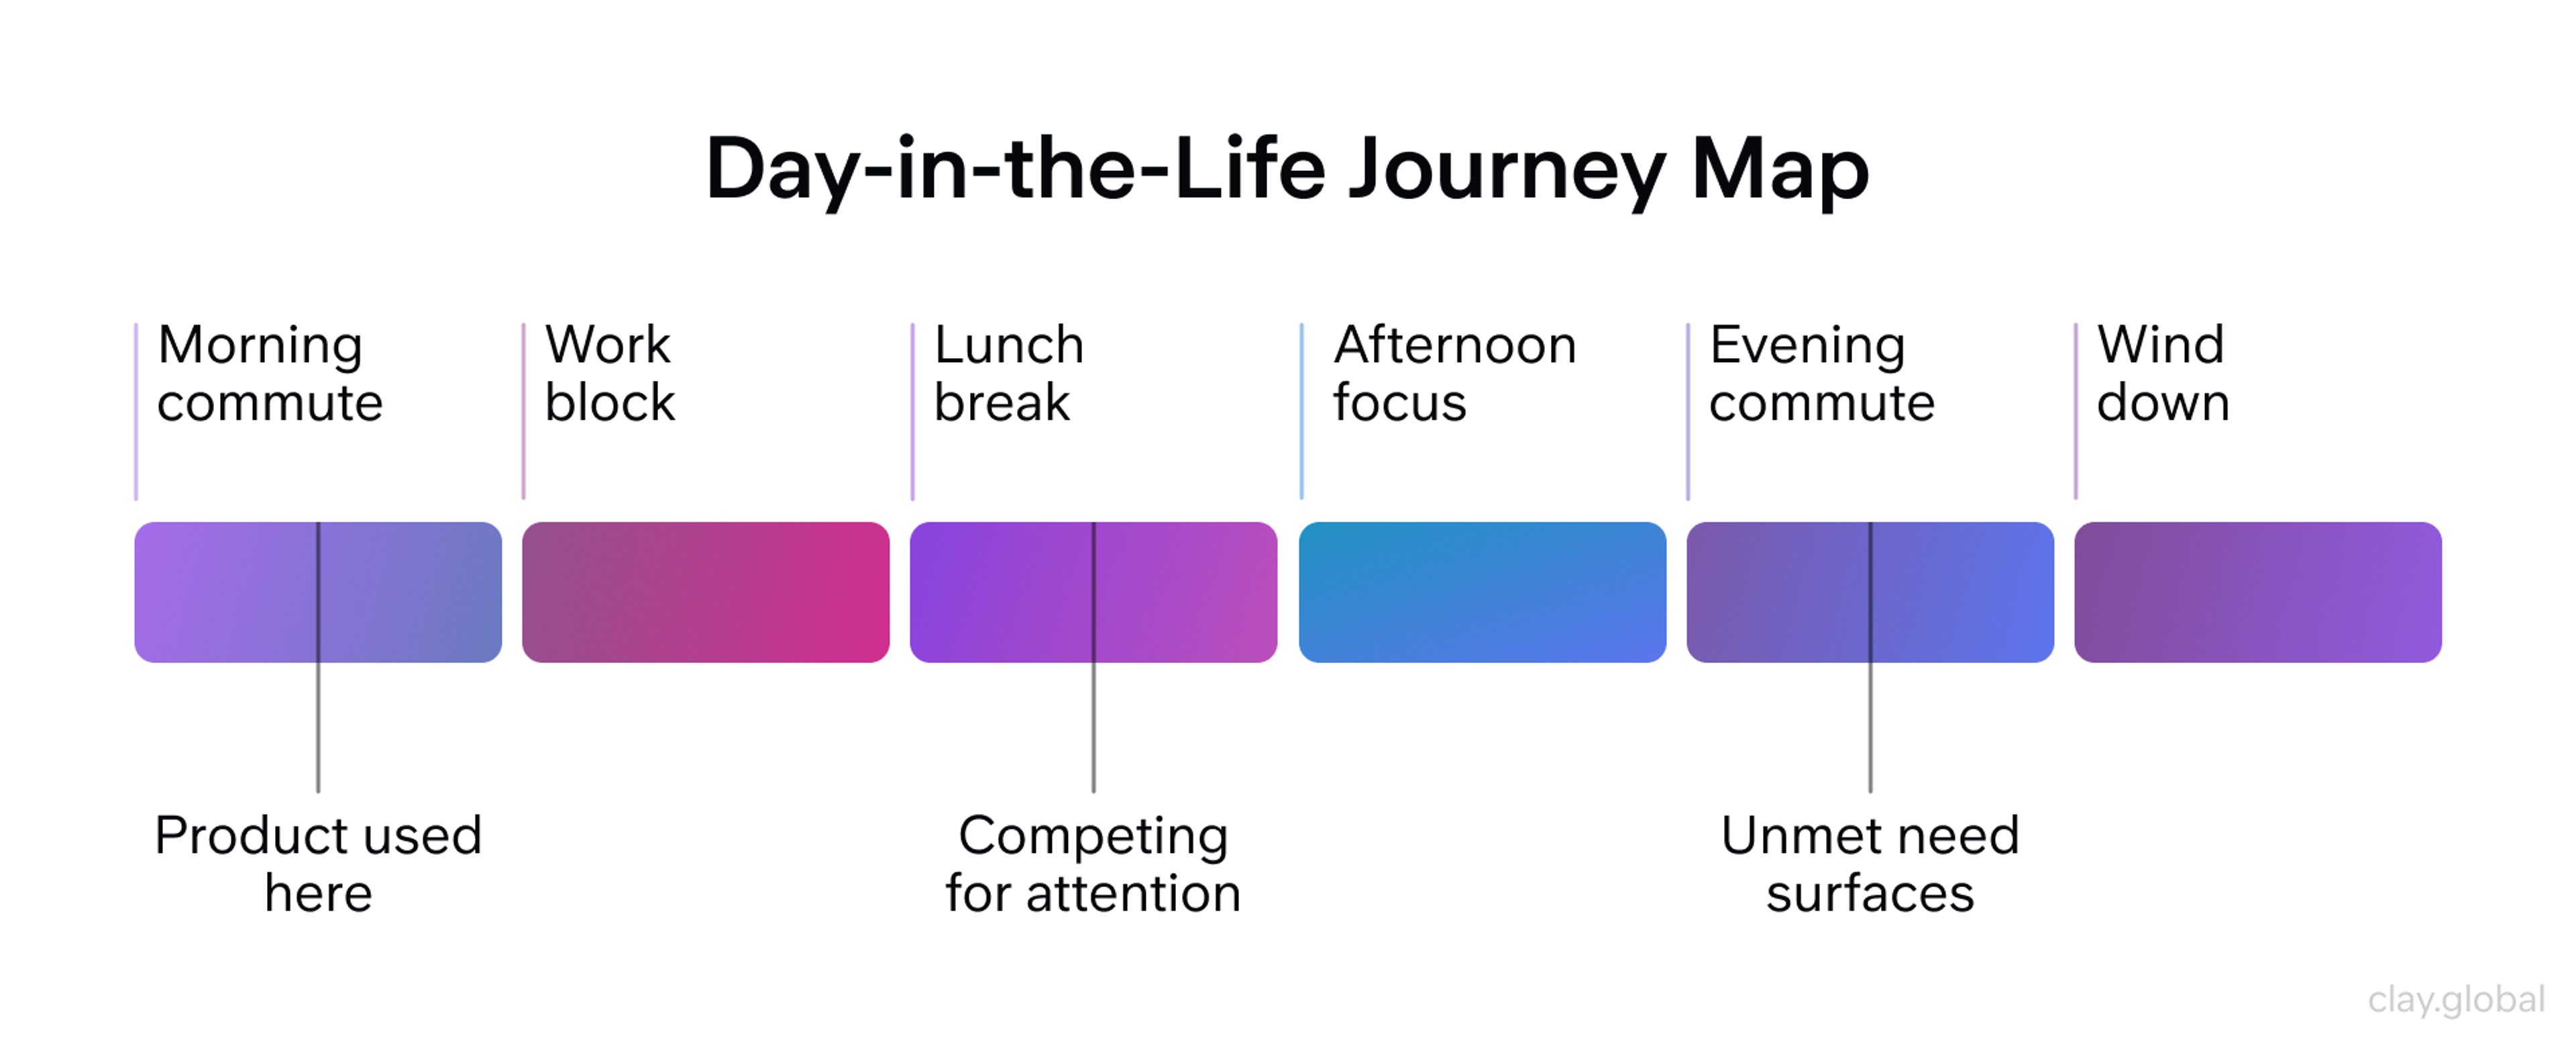
Day-in-the-life maps zoom out from a single interaction to show how your product fits into a user's broader routine. These reveal context that touchpoint-level maps miss entirely, like why a user only opens your app during a specific 20-minute window on their commute, and what else is competing for their attention during that window.
Day-in-the-life Map Template by Clay
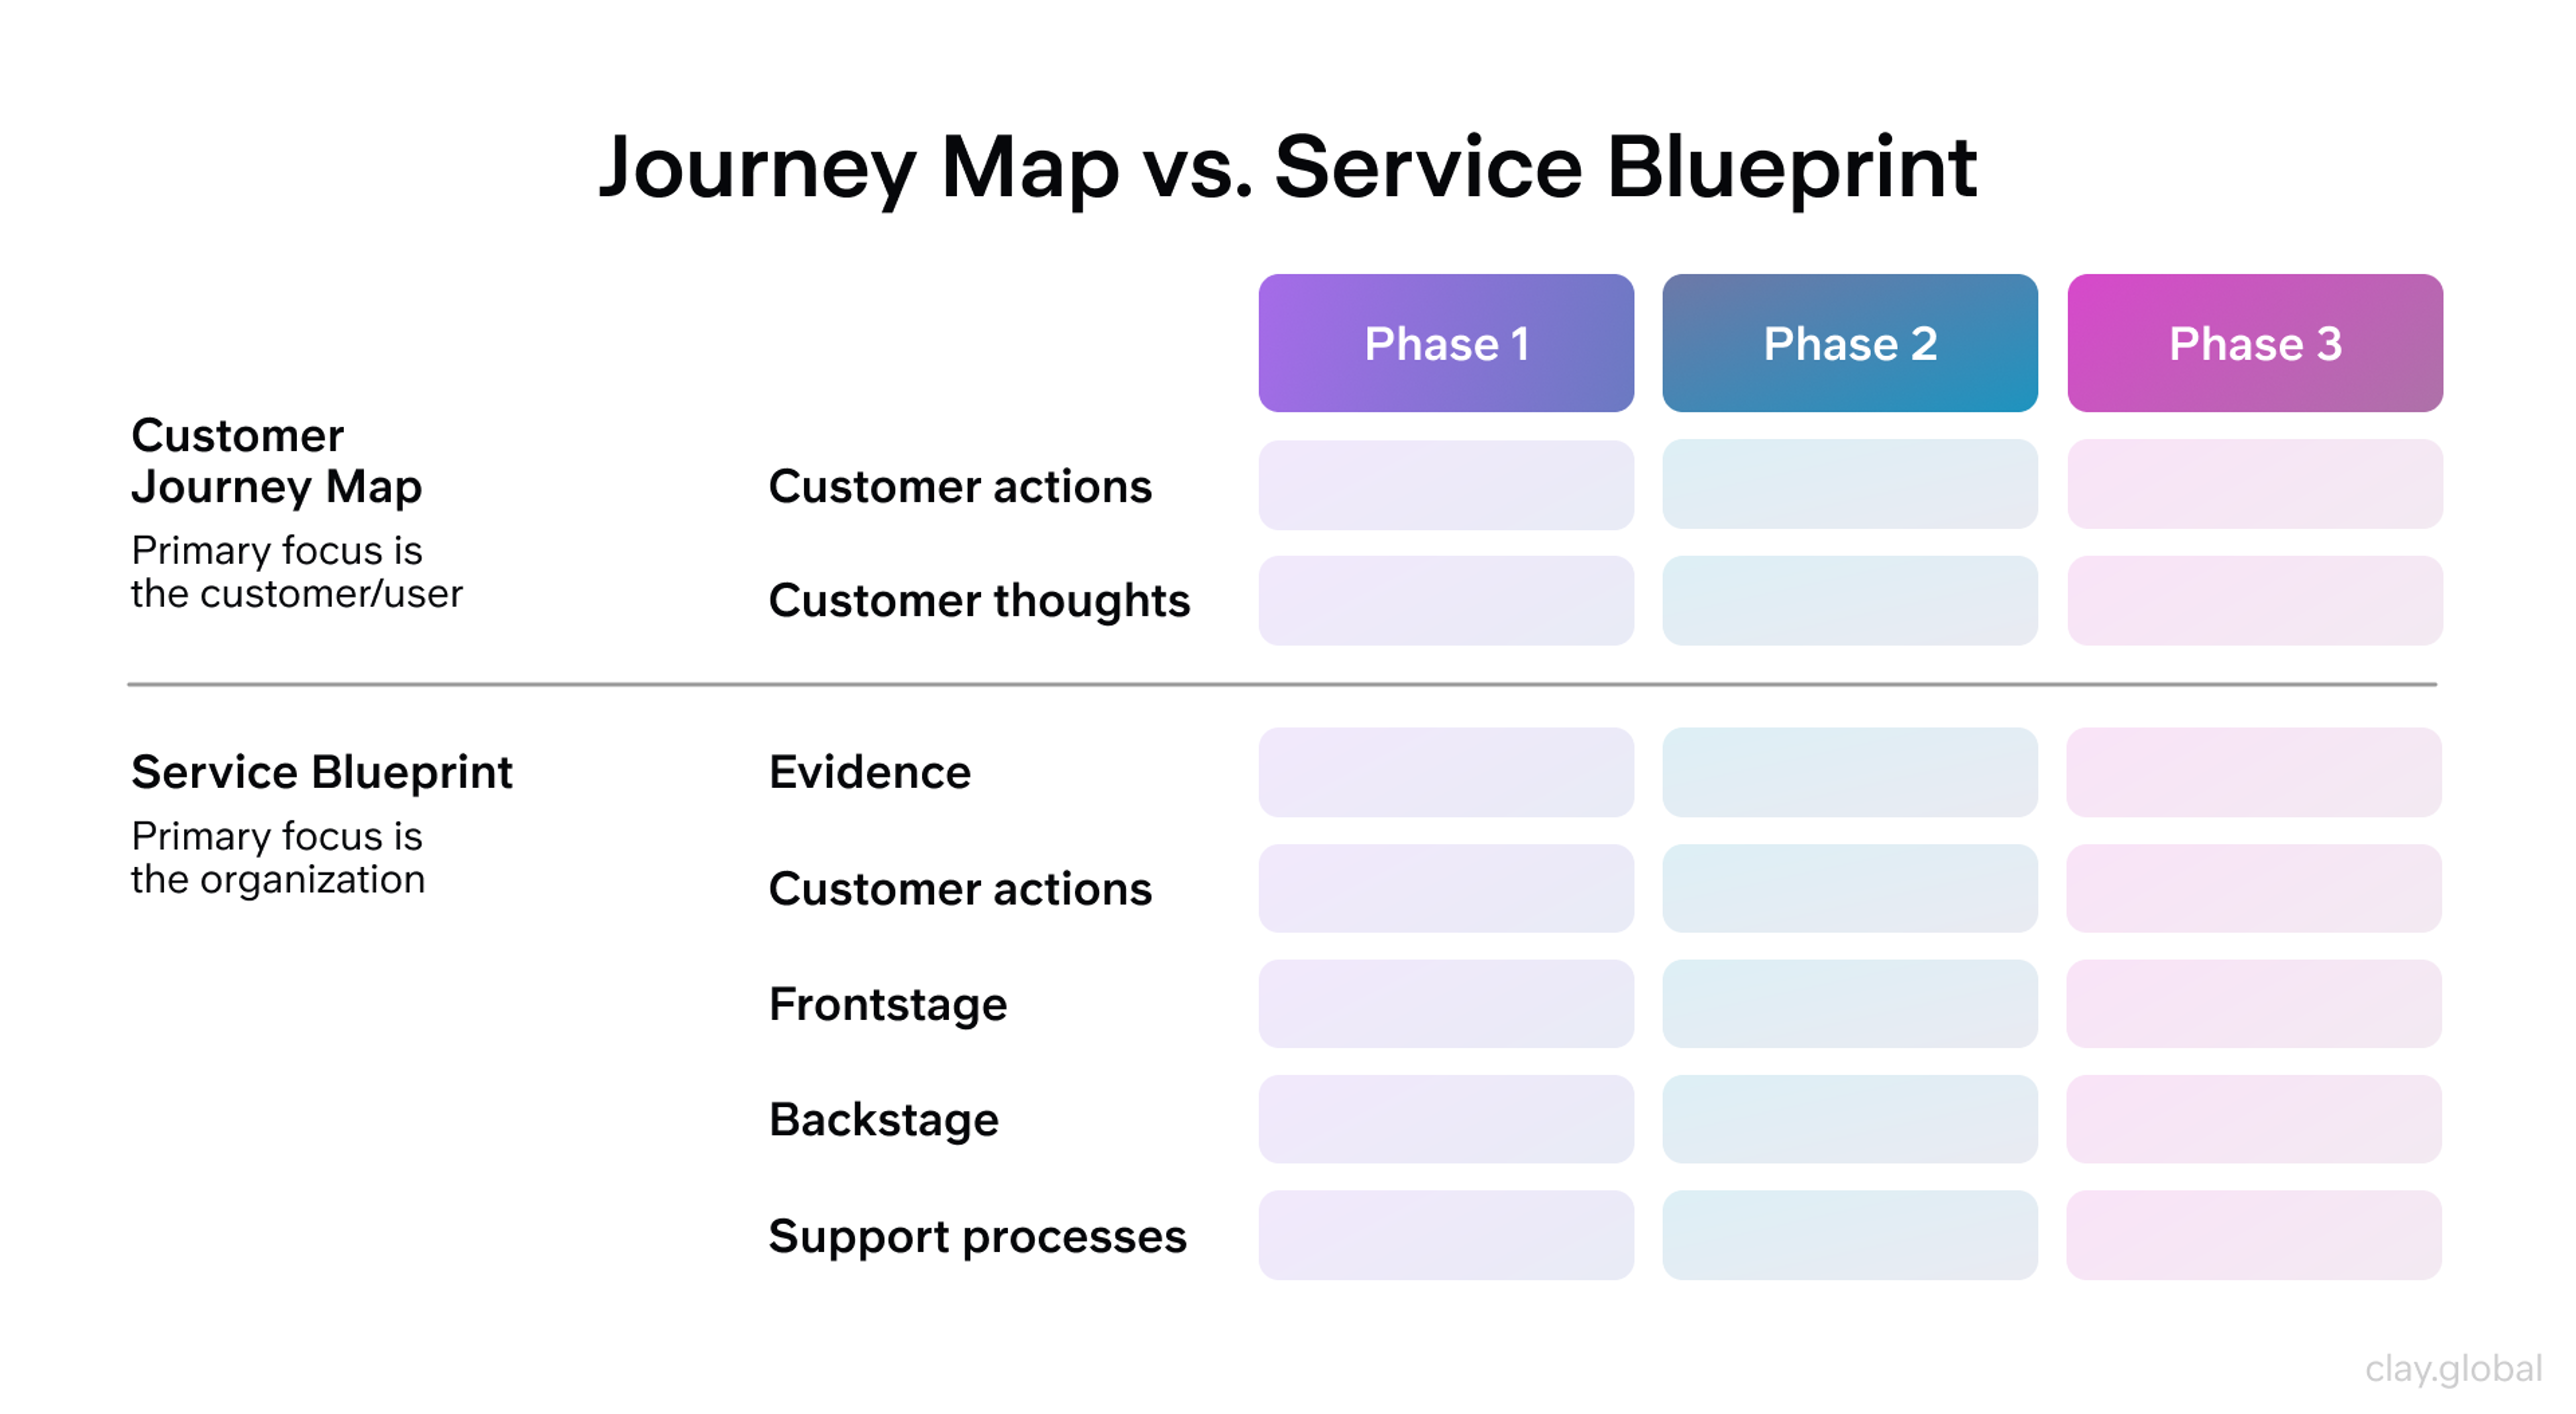
Service blueprints extend a journey map behind the curtain. Where a journey map tracks what the user experiences, a blueprint adds the backend systems, staff actions, and handoffs required to deliver that experience. Use a journey map to improve the UX. Use a service blueprint when the fix requires changing an operational process, not just a screen.
Service Blueprints Template by Clay
Industry-Specific Journey Mapping
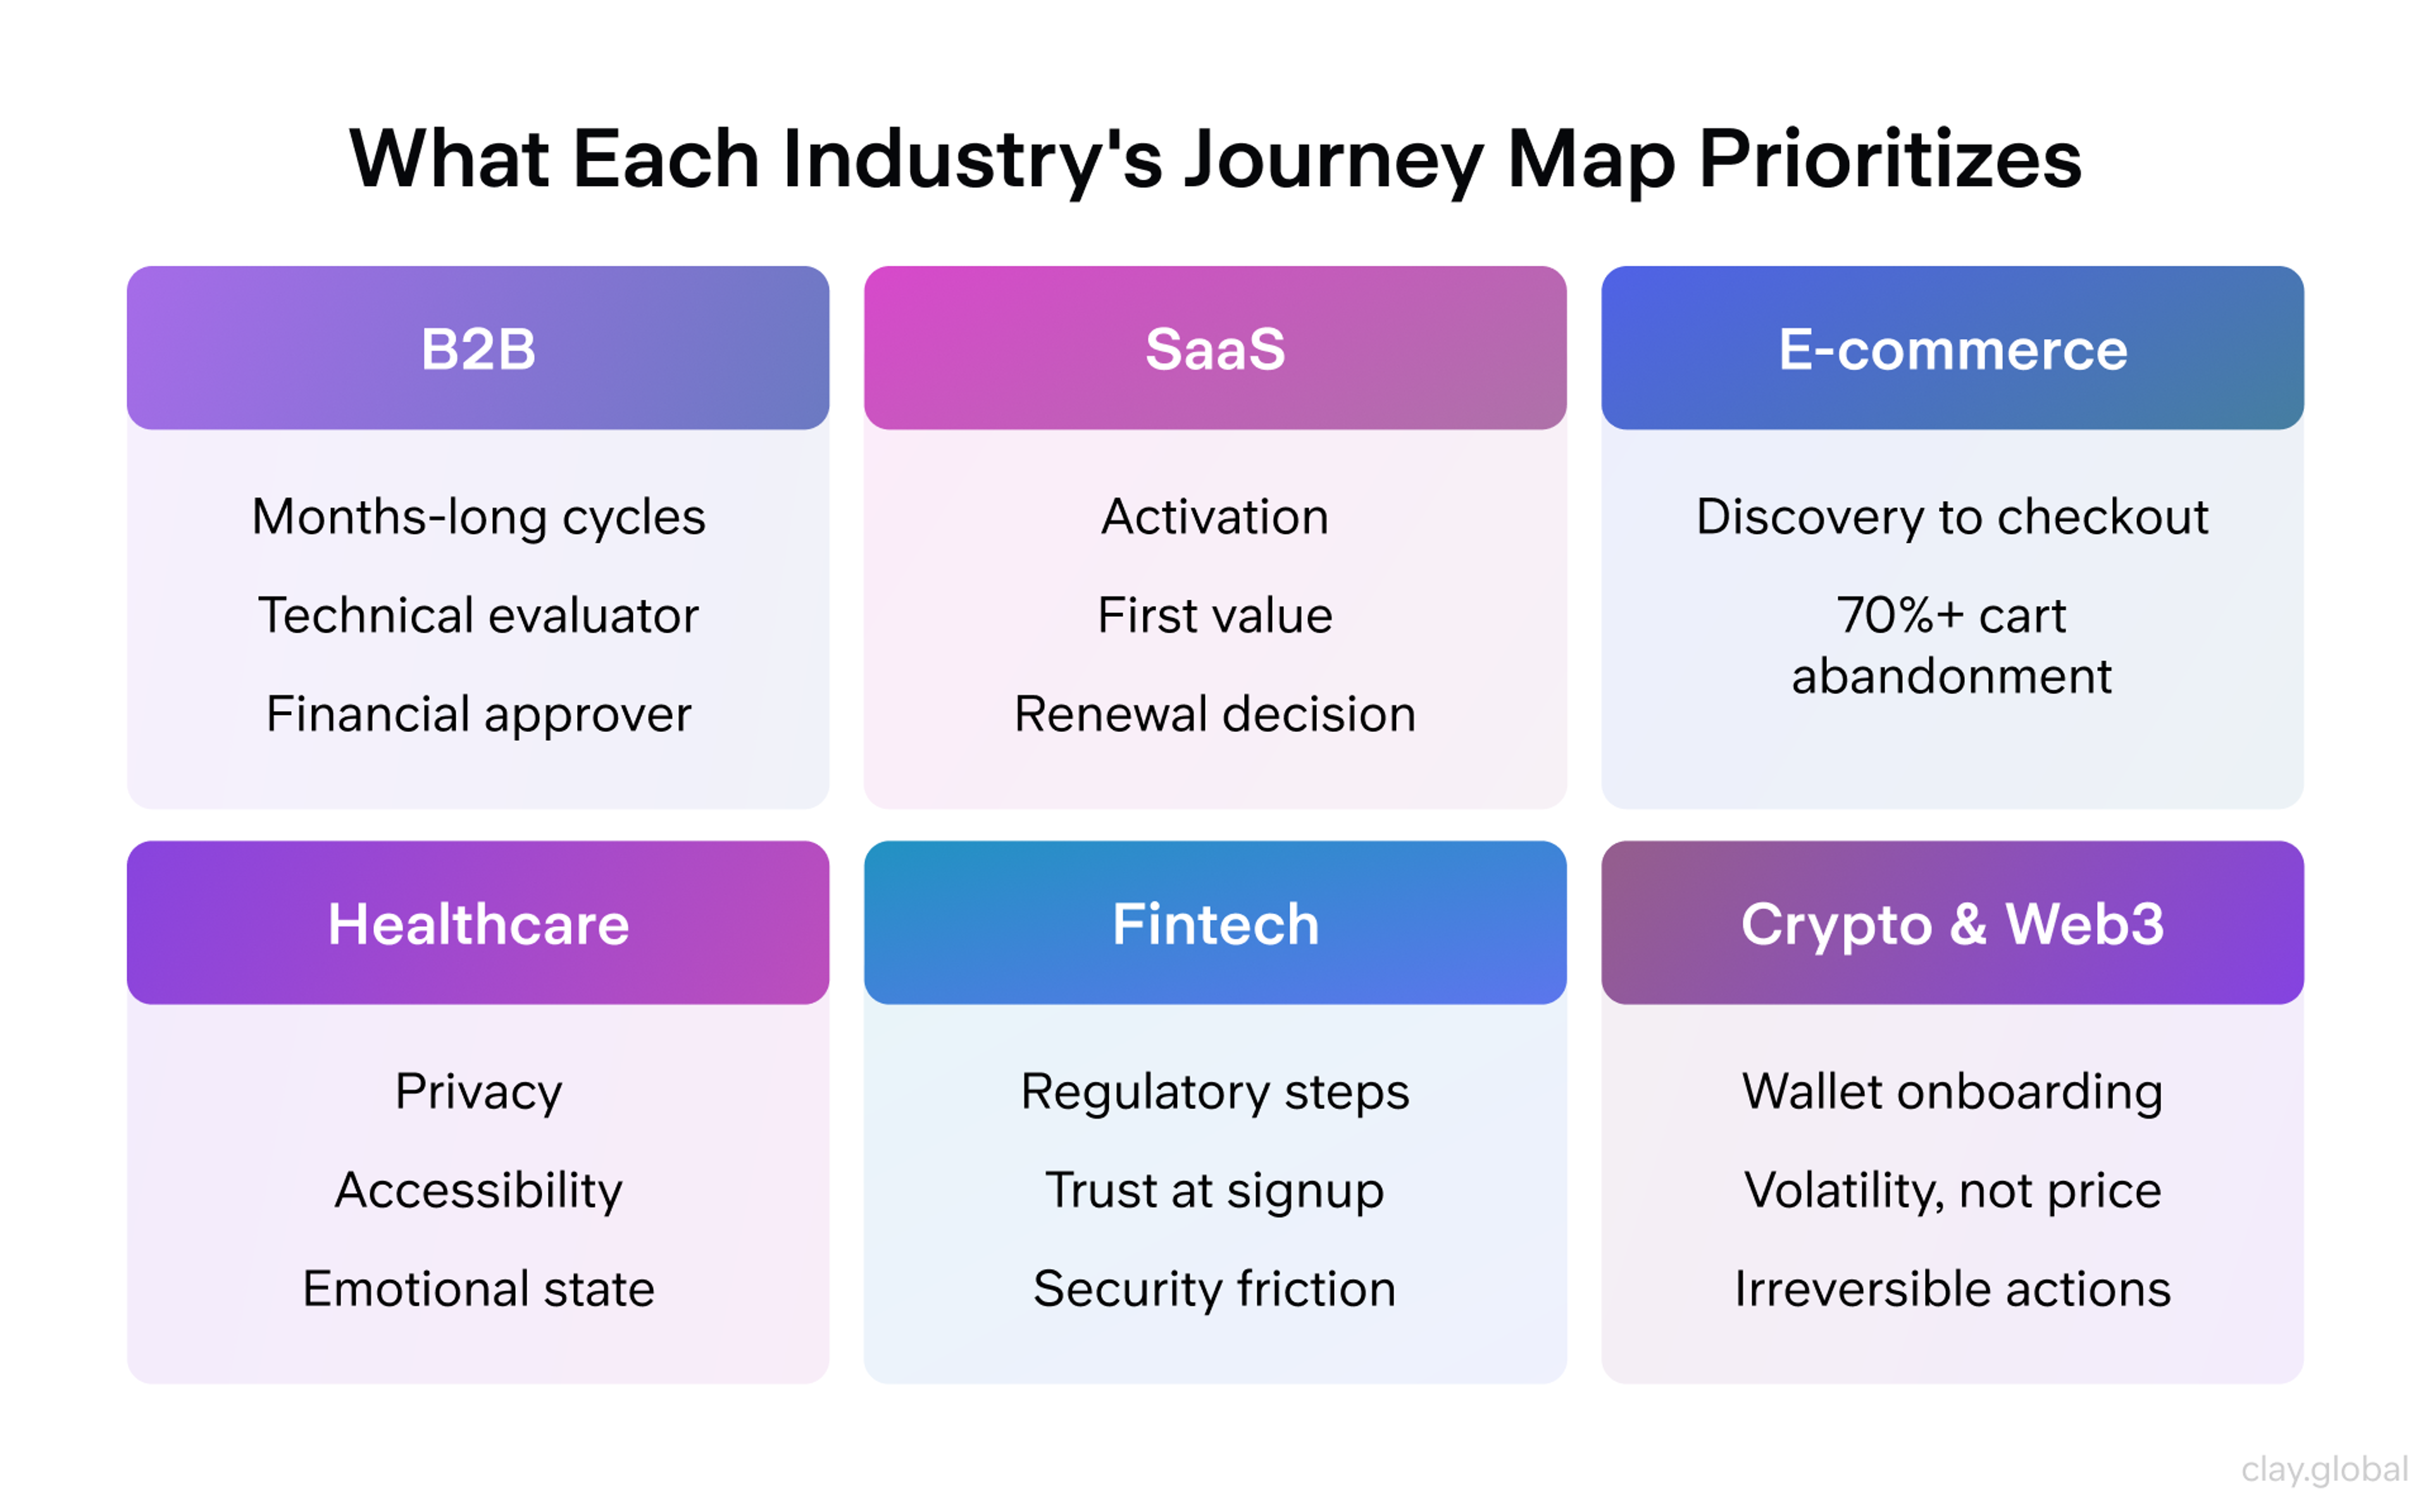
The shape of a journey changes by business model, and mapping it the same way regardless of industry produces a map that misses what actually matters to that business.
B2B journeys stretch across months and involve multiple stakeholders with different priorities. A technical evaluator, a financial approver, and an end user all touch the product differently and need to be tracked separately, not folded into one generic persona.
SaaS journeys live and die on retention, so activation, first value, and the renewal decision matter more than the initial signup.
E-commerce journeys concentrate on the path from discovery to checkout, which is why cart abandonment gets so much mapping attention in that space.
Healthcare journeys carry emotional weight and regulatory constraints that don't show up anywhere else: privacy, accessibility, and a user's emotional state directly shape what "good" looks like at each touchpoint.
Fintech journeys carry a trust burden most other industries don't. Regulatory steps like identity verification add friction, so the mapping question isn't how to remove those steps, but rather how to make each one feel like protection rather than an obstacle.
Crypto and Web3 journeys push that further. Onboarding churn in crypto wallets runs above 70%, largely because users are asked to make irreversible decisions like securing a seed phrase, approving a transaction, or choosing a network before they've built any confidence in the system.
Map these journeys around the moment a user has to commit to something they can't undo, and design the surrounding context to reduce that anxiety rather than assuming clearer copy alone will fix it.
Industry-Specific Journey Mapping by Clay
Skipping this step and using a generic five-stage template for every project is one of the fastest ways to end up with a map that looks thorough but tells your team nothing they didn't already assume.
A website that works hard across fintech, crypto, B2B, and beyond - we've done it for some of the most demanding industries out there. Yours could be next.
How to Map a Customer Journey Step-by-Step
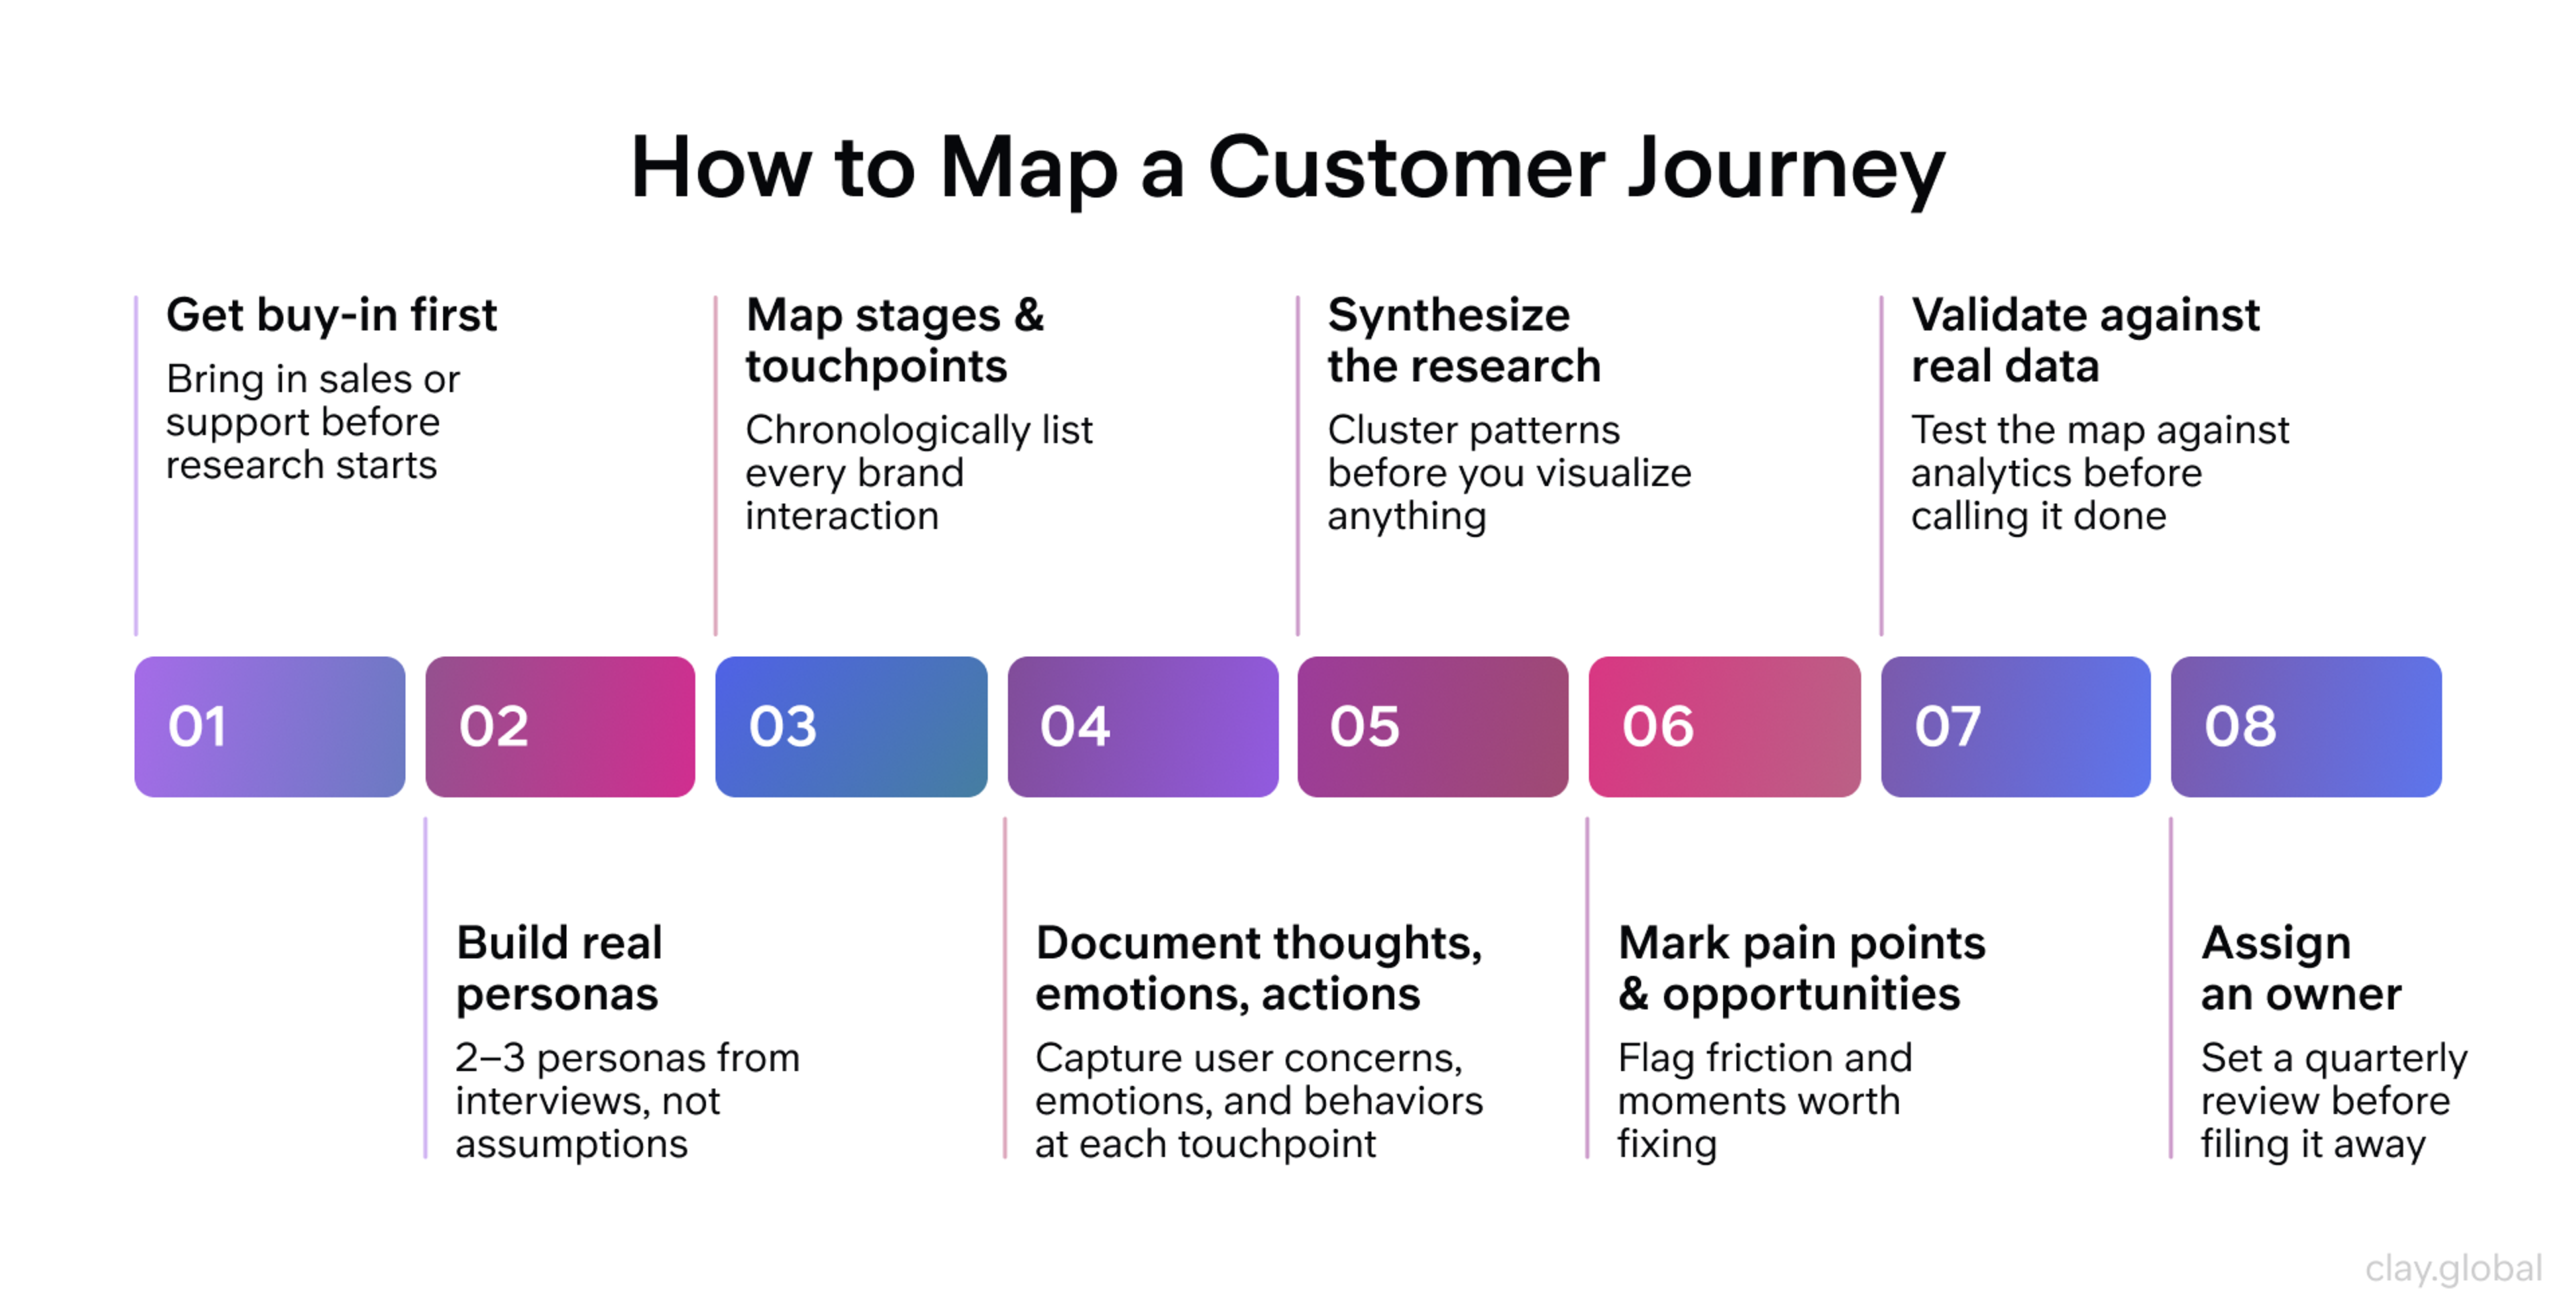
Step 1: Get the Right People in the Room Before You Start
Journey mapping fails more often from lack of buy-in than lack of data. Bring in a stakeholder from outside design, someone from sales, support, or product, before you start research, not after you present the finished map.
Sales and support teams sit closest to the friction you're trying to document, and a map built without their input is missing the context that makes it credible to the rest of the org.
Step 2: Build Personas from Research
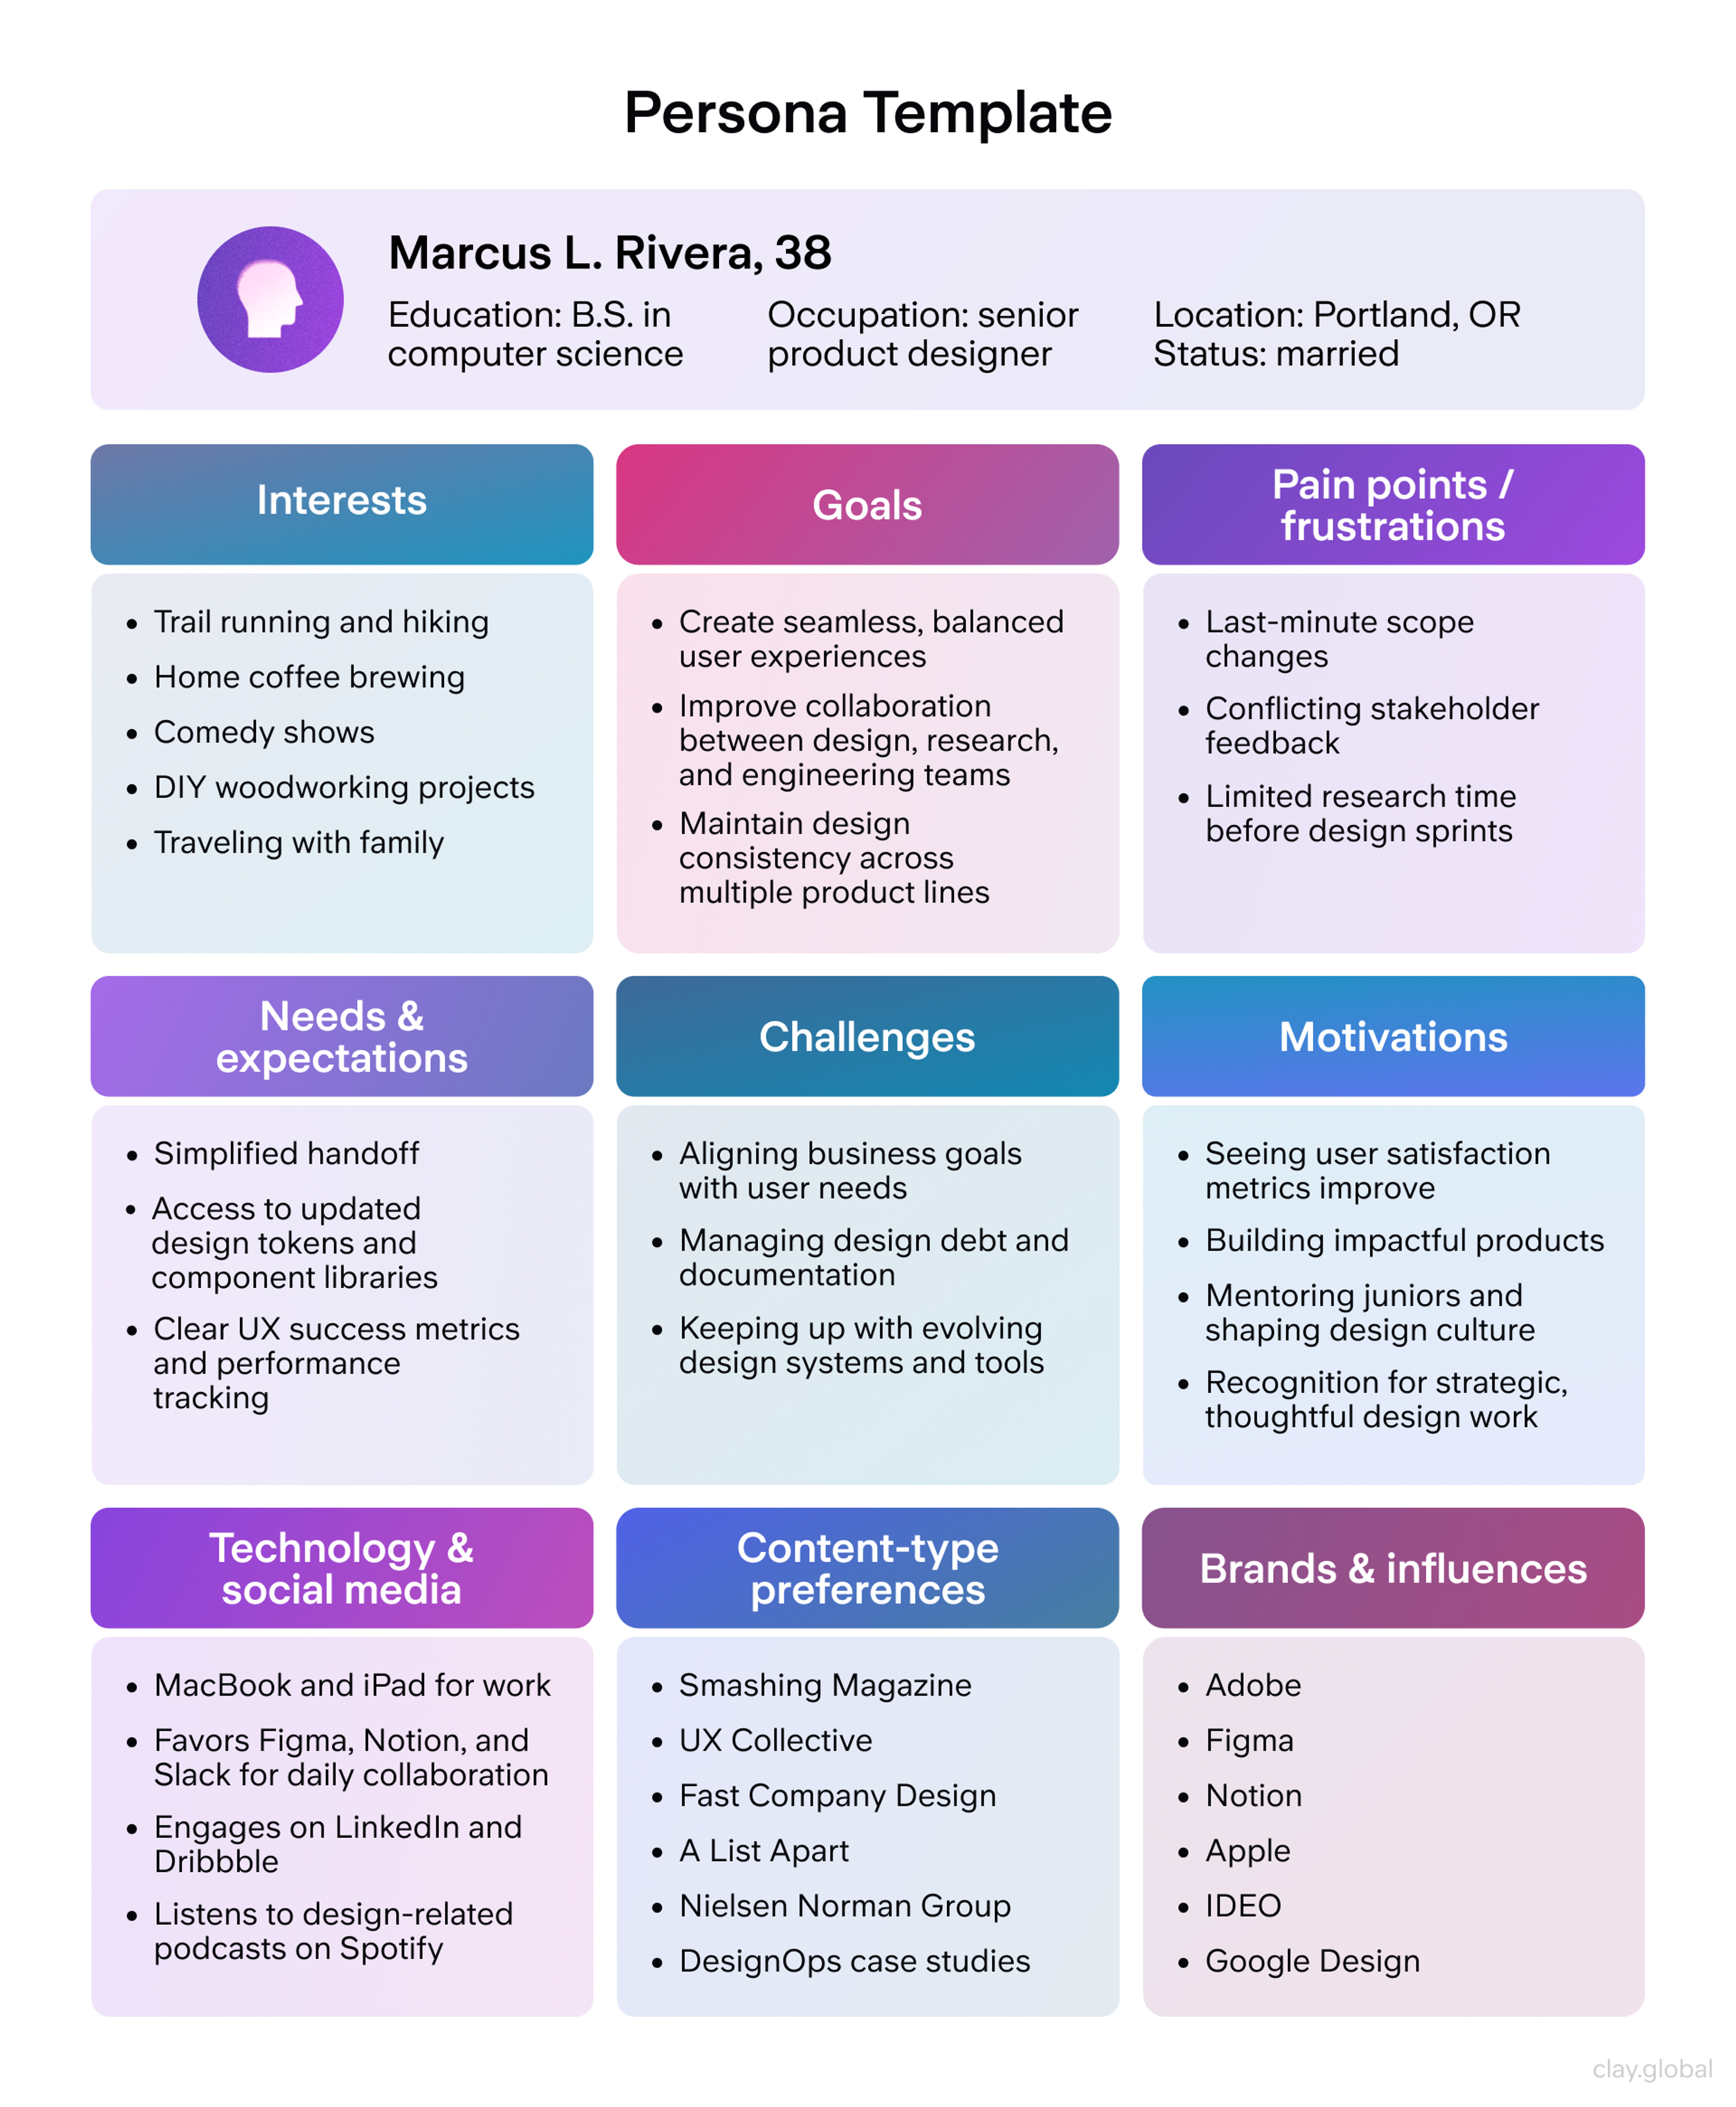
Interview real users, review support tickets, and pull session recordings before you write anything down. Build data-driven personas rather than internal guesses, and limit yourself to 2-3 of them. More than that, and the map stops being a decision tool and turns into a reference document nobody reads end to end.
If your team can't run 8-12 interviews per persona, scale down: 4-5 structured conversations paired with support ticket analysis still beats a persona built entirely on assumptions.
User Persona Example by Clay
Step 3: Map Stages and Touchpoints
Chronologically list every point where a user interacts with your brand, including channels outside your product: social mentions, word of mouth, competitor comparisons, and what happens after the sale closes.
Use the "moments that matter" filter here. Identify 5-7 key stages and 3-5 touchpoints per stage. More than that dilutes the map's usefulness rather than adding rigor.
Step 4: Document Thoughts, Emotions, and Actions at Each Touchpoint
For every touchpoint, capture three layers: what the user is thinking ("Is this secure?"), how they're feeling (confident, frustrated, overwhelmed), and what they're actually doing (click, scroll, abandon).
Use real quotes from research wherever you can. A map built on assumed thoughts and feelings is a map built on the same guesswork you're trying to eliminate.
Step 5: Synthesize Before You Visualize
This is the step almost every guide skips, and it's the one that determines whether your map holds up under scrutiny. Raw interview transcripts and support tickets don't arrange themselves into five clean stages. You have to find the pattern first.
Start by clustering verbatims and observed behaviors by theme, not by interview. A comment about pricing confusion from interview 3 and a support ticket about the same confusion from a different user are the same signal, and they should live in the same cluster regardless of source. From there, look for where the clusters cohere into a natural break, that's a stage boundary. Where they don't cohere, you likely need another interview, not another guess.
How to Map a Customer Journey Step-by-Step
AI-assisted transcript coding has made this step faster without replacing the judgment it requires. Tools that cluster verbatims by sentiment or theme can turn a week of manual tagging into an afternoon, but the synthesis decision, which clusters actually represent a distinct stage versus noise, still needs a human who understands the business context. Treat AI output here as a first pass to sort through, not a finished map.
Step 6: Mark Pain Points and Opportunities
Once the stages are set, go back through and flag where users struggle and where you could reduce friction or add value. Color-code or use clear indicators so the map is scannable at a glance, not just readable if someone studies it closely.
Prioritize opportunities where high emotional intensity meets a decision point. Those are the moments where a small fix produces an outsized result.
Step 7: Validate Against Real Data
Test the map against analytics before you circulate it as finished. Does the flow match what Google Analytics or your product analytics tool actually shows? Do the pain points you flagged match what usability testing surfaces?
If a stakeholder from sales or support looks at the map and says it doesn't match what they hear from customers, that's a signal to go back to Step 5, not a reason to defend the draft.
Step 8: Assign an Owner and a Review Date
A journey map is accurate for as long as your product stays the same, which in practice is a few months. Name one person responsible for the map's accuracy and set a quarterly review on the calendar before you file the first version away. Maps that don't have an assigned owner are the ones that quietly go stale and get rebuilt from scratch a year later instead of updated.
Real Journey Maps in Action
Airbnb's journey maps surfaced something the team hadn't fully appreciated: users felt most anxious in the three weeks between booking and arrival, a stretch with almost no communication from the platform. That single insight led directly to Airbnb's automated messaging system, which now fills that gap with confirmations, local recommendations, and check-in reminders. The map didn't just describe the problem, it pointed to exactly where the fix needed to live.
Spotify takes a different approach, maintaining separate journey maps for distinct listener types rather than one map for "the Spotify user." Discovery-focused listeners, background-music users, and active explorers each get a different interface treatment and recommendation logic, because a single generic journey would have flattened three genuinely different sets of needs into one that served none of them well.
We've seen the same pattern play out in our own client work. When we partnered with Lulo Bank, Colombia's first fully digital, carbon-neutral bank, mapping the onboarding journey was what surfaced where new users hesitated during account setup - moments a fully digital bank with no branch to fall back on couldn't afford to get wrong. That research shaped the micro-interactions and screen-by-screen flow that followed.
Lulo Bank UI Kit by Clay
On the B2B side, our work with Cornerstone, a cloud-based HR platform covering the full employee lifecycle from onboarding to skills training, involved streamlining a genuinely complex user journey across more than 50 web pages so that different stakeholder types, HR admins, managers, and employees, could each find their path through the same site without friction.
And with Discover, journey mapping their mobile app directly shaped how we approached onboarding, card activation, and feature discovery, turning a set of disconnected flows into a cohesive, testable structure.
Discover Wireframes by Clay
The through-line across all examples: the map's value showed up at the exact moment someone had to decide what to build next. That's the test for whether a journey mapping exercise was worth running.
Measuring the Impact of Customer Journey Mapping
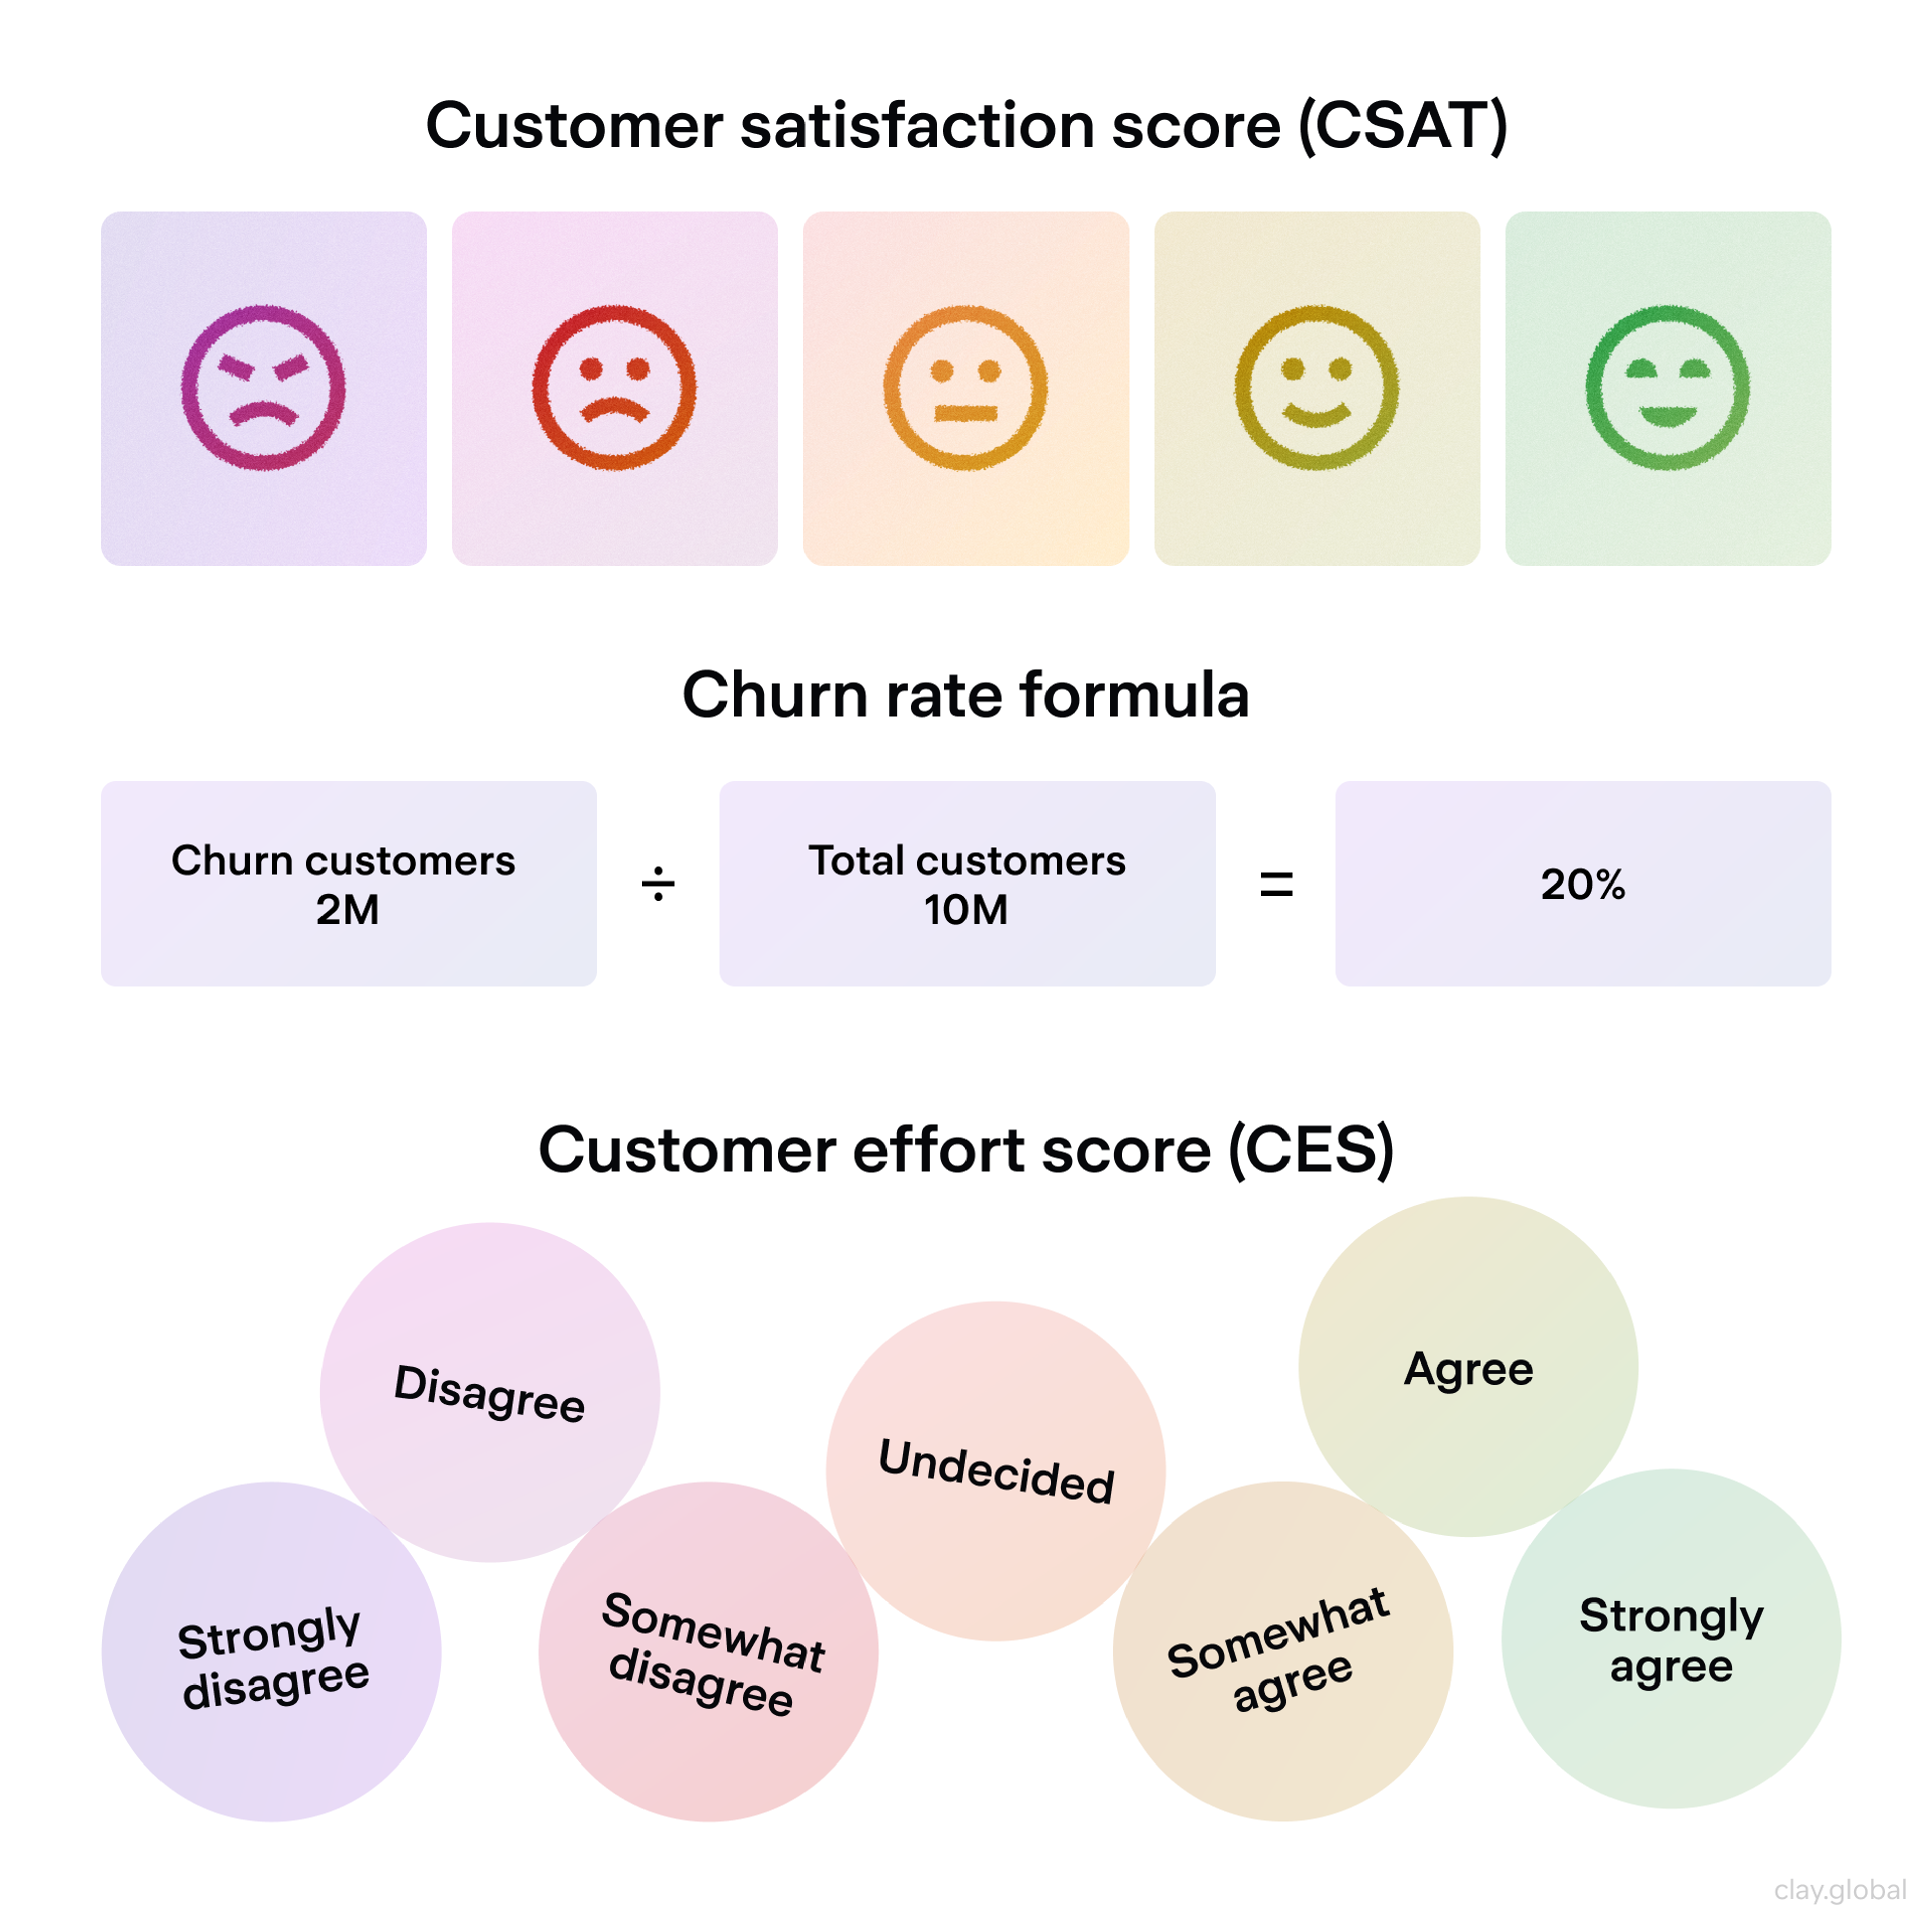
Set a specific goal before you map anything: higher satisfaction, lower churn, fewer support escalations, so you know what "worked" actually means. Then track it against a small set of indicators rather than everything you can think of:
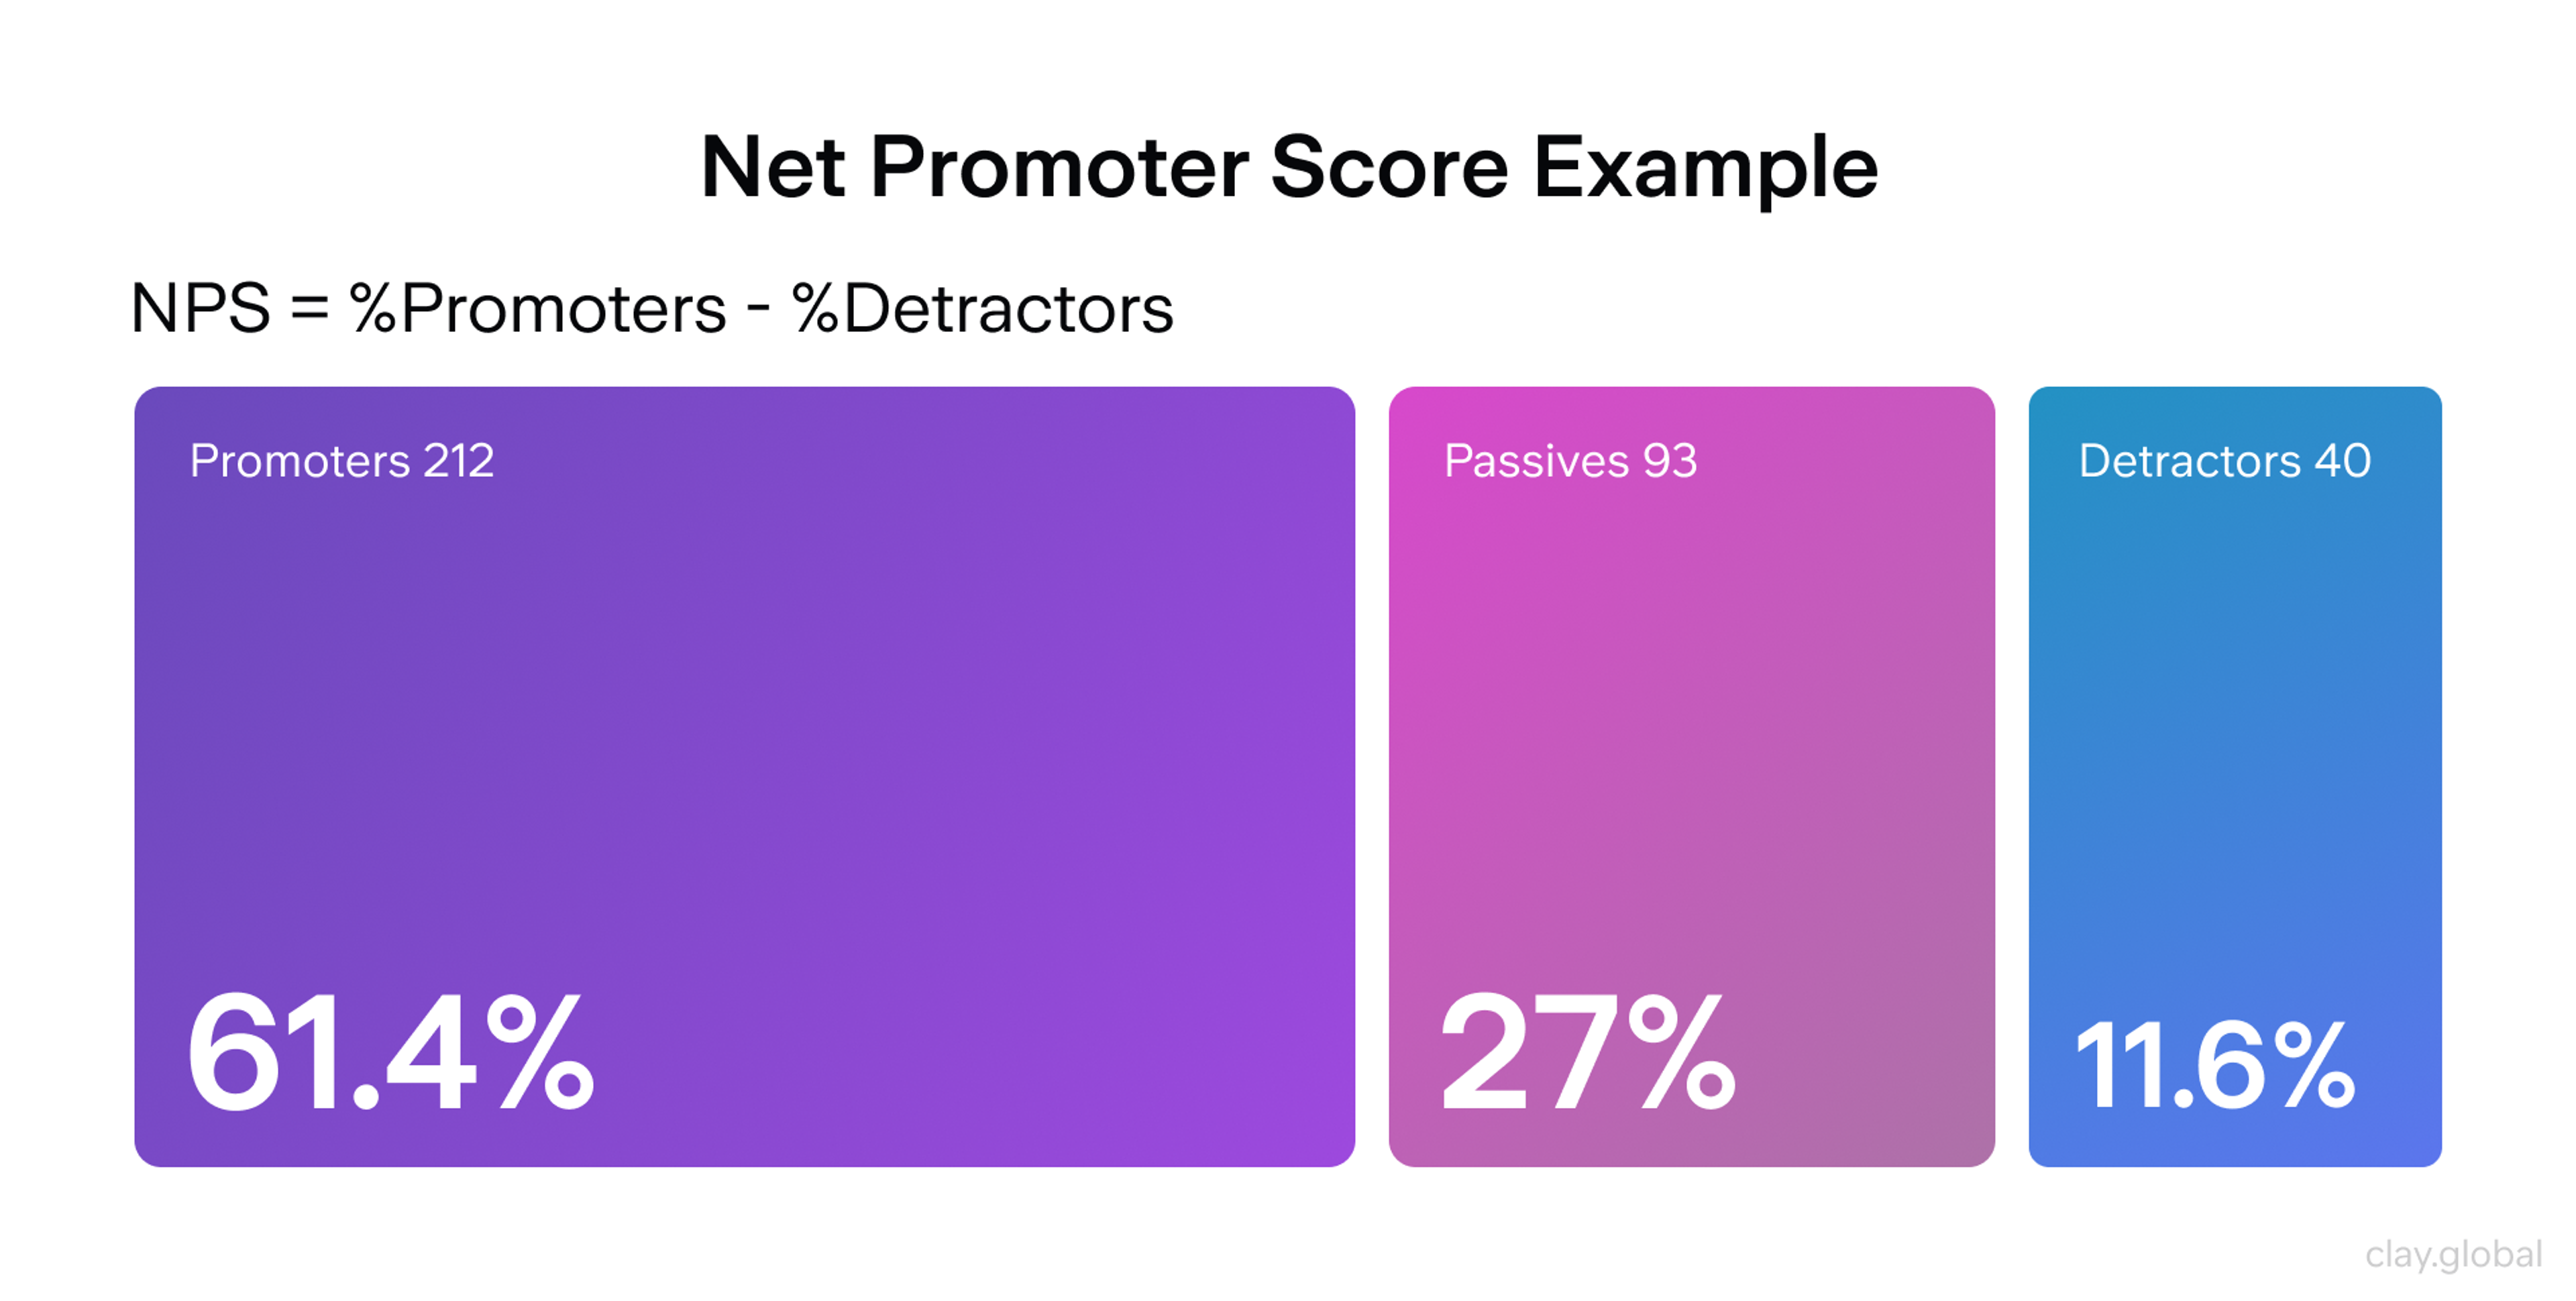
- Customer satisfaction and Net Promoter Score, tracked before and after changes shipped from the map
- Customer Effort Score at the specific touchpoints you flagged as high-friction
- Conversion rate at each mapped stage, not just overall funnel conversion
- Churn and retention rate, segmented by the persona the map represents
- Customer lifetime value, particularly if the map covers post-purchase stages
NPS Example by Clay
CSAT, Churn Rate, CES Metrcis by Clay
Journey mapping isn't a one-time project with a finish line. The team that revisits its map against fresh data every quarter is the team whose map still reflects reality a year from now.
Tools to Get Started
Figma works well if your team already lives there for design work: free at the entry tier, real-time collaboration, and it keeps the map close to the files it needs to inform.
Miro is the better call for cross-functional workshops, built for the sticky-note, whiteboard-style collaboration a first mapping session with sales and support actually needs.
UXPressia is worth the subscription if journey mapping is a recurring practice rather than a one-off project, with persona tools and templates general design tools don't offer.
Whichever tool you pick, the format matters far less than what feeds it. A polished map built on assumptions is still a map built on assumptions.
From Google's wearable experience to Snapchat’s AR try-on lenses, we've helped teams across every industry design products people actually want to use. Let's talk about yours.
Read More
- Clay Global’s Digital Design Case Studies
FAQ
What Is the Difference Between a Customer Journey Map and a Service Blueprint?
A journey map shows what a user does, thinks, and feels while interacting with your product. A service blueprint adds everything happening behind the scenes, systems, staff, and handoffs, required to deliver that experience.
What Is the Difference Between a Customer Journey Map and a Funnel?
A funnel tracks measurable steps toward a single conversion goal. A journey map captures the full experience, including emotional context and what happens before and after that conversion point.
When Should I Create a Customer Journey Map?
Map a journey when you're launching something new, redesigning an existing experience, chasing down a specific pain point, or trying to get several teams aligned on how customers actually move through your product.
How Often Should I Update a Customer Journey Map?
Quarterly, at minimum, or immediately after any major product change. A map built on last year's product tells you about last year's users.
How Detailed Should a Customer Journey Map Be?
Five to seven stages with a handful of touchpoints each. Detailed enough to surface real problems, simple enough that someone outside the project can read it in a few minutes and understand what it's telling them.
Who Should Be Involved in Creating a Customer Journey Map?
UX, product, and at least one person from sales or support, brought in before research starts rather than shown the finished map afterward. Marketing and engineering should review it once it's drafted.
How Many Personas Should One Journey Map Represent?
One. If you're mapping two meaningfully different user types, build two maps. Combining them produces a map that's technically accurate for nobody.
What's the Biggest Reason Journey Maps Fail to Get Used?
No assigned owner. A map with nobody responsible for keeping it current becomes outdated within a quarter and gets quietly ignored until someone rebuilds it from scratch.
Can I Build a Journey Map Without a Big Research Budget?
Yes. Four to five structured interviews per persona, combined with support ticket analysis and existing analytics, will surface real patterns. It won't be as exhaustive as 12 interviews per persona, but it will still beat a map built on internal assumptions.
Do Journey Maps Work for B2B Companies?
Yes, but they need to account for multiple stakeholders with different priorities within a single buying process. A B2B map that tracks only one persona misses the technical evaluator, the financial approver, and the end user separately influencing the same decision.
What's the Difference Between a Current-State and Future-State Map?
A current-state map documents what's actually happening today, friction included. A future-state map plans the experience you're building toward. Most redesign projects need both: one to know what's broken, one to know what you're aiming for.
How Is AI Changing Customer Journey Mapping?
AI tools now speed up the synthesis step, clustering interview transcripts and support tickets by theme or sentiment faster than manual tagging. The judgment about which clusters represent a genuine stage boundary still requires a person who understands the business, not just the output.
Should Journey Maps Include Data From Support Tickets?
Yes. Support tickets surface friction users didn't mention in an interview, often because they didn't think to bring it up unprompted. Cross-referencing tickets against interview themes is one of the fastest ways to validate a pattern.
Conclusion
A journey map that never changes a decision wasn't worth building. The version worth building is the one where synthesis gets real time instead of getting rushed past, where a stakeholder outside design signs off before the research starts, and where someone owns the thing after the kickoff meeting ends.
Pick one persona. Map their most critical stretch of the journey this month. Validate it against real data before you call it finished. That's a smaller commitment than most teams think mapping requires, and it's the version that actually gets used.


About Clay
Clay is a UI/UX design & branding agency in San Francisco. We team up with startups and leading brands to create transformative digital experience. Clients: Facebook, Slack, Google, Amazon, Credit Karma, Zenefits, etc.
Learn moreAbout Clay
Clay is a UI/UX design & branding agency in San Francisco. We team up with startups and leading brands to create transformative digital experience. Clients: Facebook, Slack, Google, Amazon, Credit Karma, Zenefits, etc.
Learn more