
Speed matters because users expect near-instant loading and leave when a site feels slow. A slow site reduces clicks, conversions, and search visibility.
It’s also a core UX signal measured by metrics like TTFB and LCP, where small delays add up fast. Improving these metrics creates smoother experiences that keep people engaged, support better rankings, and protect growth as traffic scales.
Why Website Speed Matters
Website speed is a critical factor in determining the success of a website. A slow website can lead to high bounce rates, low conversion rates, and a poor user experience. On the other hand, a fast website can improve user engagement, increase conversion rates, and boost search engine rankings.
Source: Image by vectorjuice on Freepik
In fact, a study by Google found that a delay of just one second in page load speed can result in a 7% reduction in conversions. Moreover, web performance is also a key factor in search engine optimization (SEO), with Google using page speed as a ranking signal.
Therefore, it is essential to ensure that your website loads quickly and efficiently to provide a good user experience and improve your online presence. Optimizes web performance to meet modern expectations.
Core Web Vitals
Core Web Vitals are a set of user-centered metrics that focus on three outcomes: how quickly the main content loads, how responsive the page feels when people interact, and how stable the layout remains while it renders. In 2026, the Core Web Vitals are LCP, INP, and CLS (INP replaced FID).
- Largest Contentful Paint (LCP) measures loading performance by tracking when the largest visible piece of content finishes rendering. For a good user experience, aim for LCP within 2.5 seconds (at the 75th percentile).
- Interaction to Next Paint (INP) measures how responsive a page feels by observing interaction latency across the full lifecycle of a page. A page can load fast but still feel “laggy” if it does too much work on the main thread. For a good experience, aim for INP of 200 ms or less.
- Cumulative Layout Shift (CLS) measures visual stability by quantifying unexpected layout movement during loading. For a good experience, aim for CLS of 0.1 or less.
One important nuance: Core Web Vitals assessments are based on real-user (field) data where available, and that data is aggregated over a rolling 28-day window. That’s why improvements can take time to fully show up in reporting tools.
Thanks to improving these metrics, site owners are now able to provide a better user experience while still adhering to search engines’ preferred performance thresholds, including Google’s.
Detailed Overview of Additional Important Metrics
This section will focus on the different metrics or parameters that aid in optimizing the web's overall performance.
This will help outline the work needed to provide an exceptional user experience. Some of these metrics help pinpoint focus areas of web pages that need improvement.
Time to First Byte (TTFB): TTFB represents the time to first byte. It is the time it takes for the first byte to reach the user's browser after the user has requested the server. A low TTFB is extremely important to enhance page load speed, improving the overall user experience.
First Contentful Paint (FCP): FCP, or first contentful paint, is the time measured, which marks the time when the first text or image is rendered and hence visible to the user. This metric is important as FCP helps measure how much time the user spends in order to see that a page is in the process of loading or rendering.
Time to Interactive (TTI): Smooth transitioning on a webpage interactively works when a user clicks a link on a webpage without lagging. Hence, less TTI means less lag and a smoother experience navigating the webpage.
Total Blocking Time (TBT): Total Blocking Time (TBT) is the time slice a computer allocates to each interactive session after the 'First Contentful Paint' (FCP) to respond to a user action initiated on the webpage.
TBT is one of the leading causes of sluggish and unresponsive websites. Hence, it must always be reduced, as it hampers seamless interactions.
Core Web Vitals and TBT (total blocking time) can be tracked to create user-focused and easily accessible websites that satisfy marketing search engine best practices.
Online Tools
- Google PageSpeed Insights: A free online tool that provides performance insights and suggestions for optimization based on Core Web Vitals metrics.
- SpeedCurve: A performance monitoring tool that helps track real user experiences and webpage performance over time.
- Uptrends: Allows performance checks from multiple locations worldwide, offering detailed reports on load times and speed.
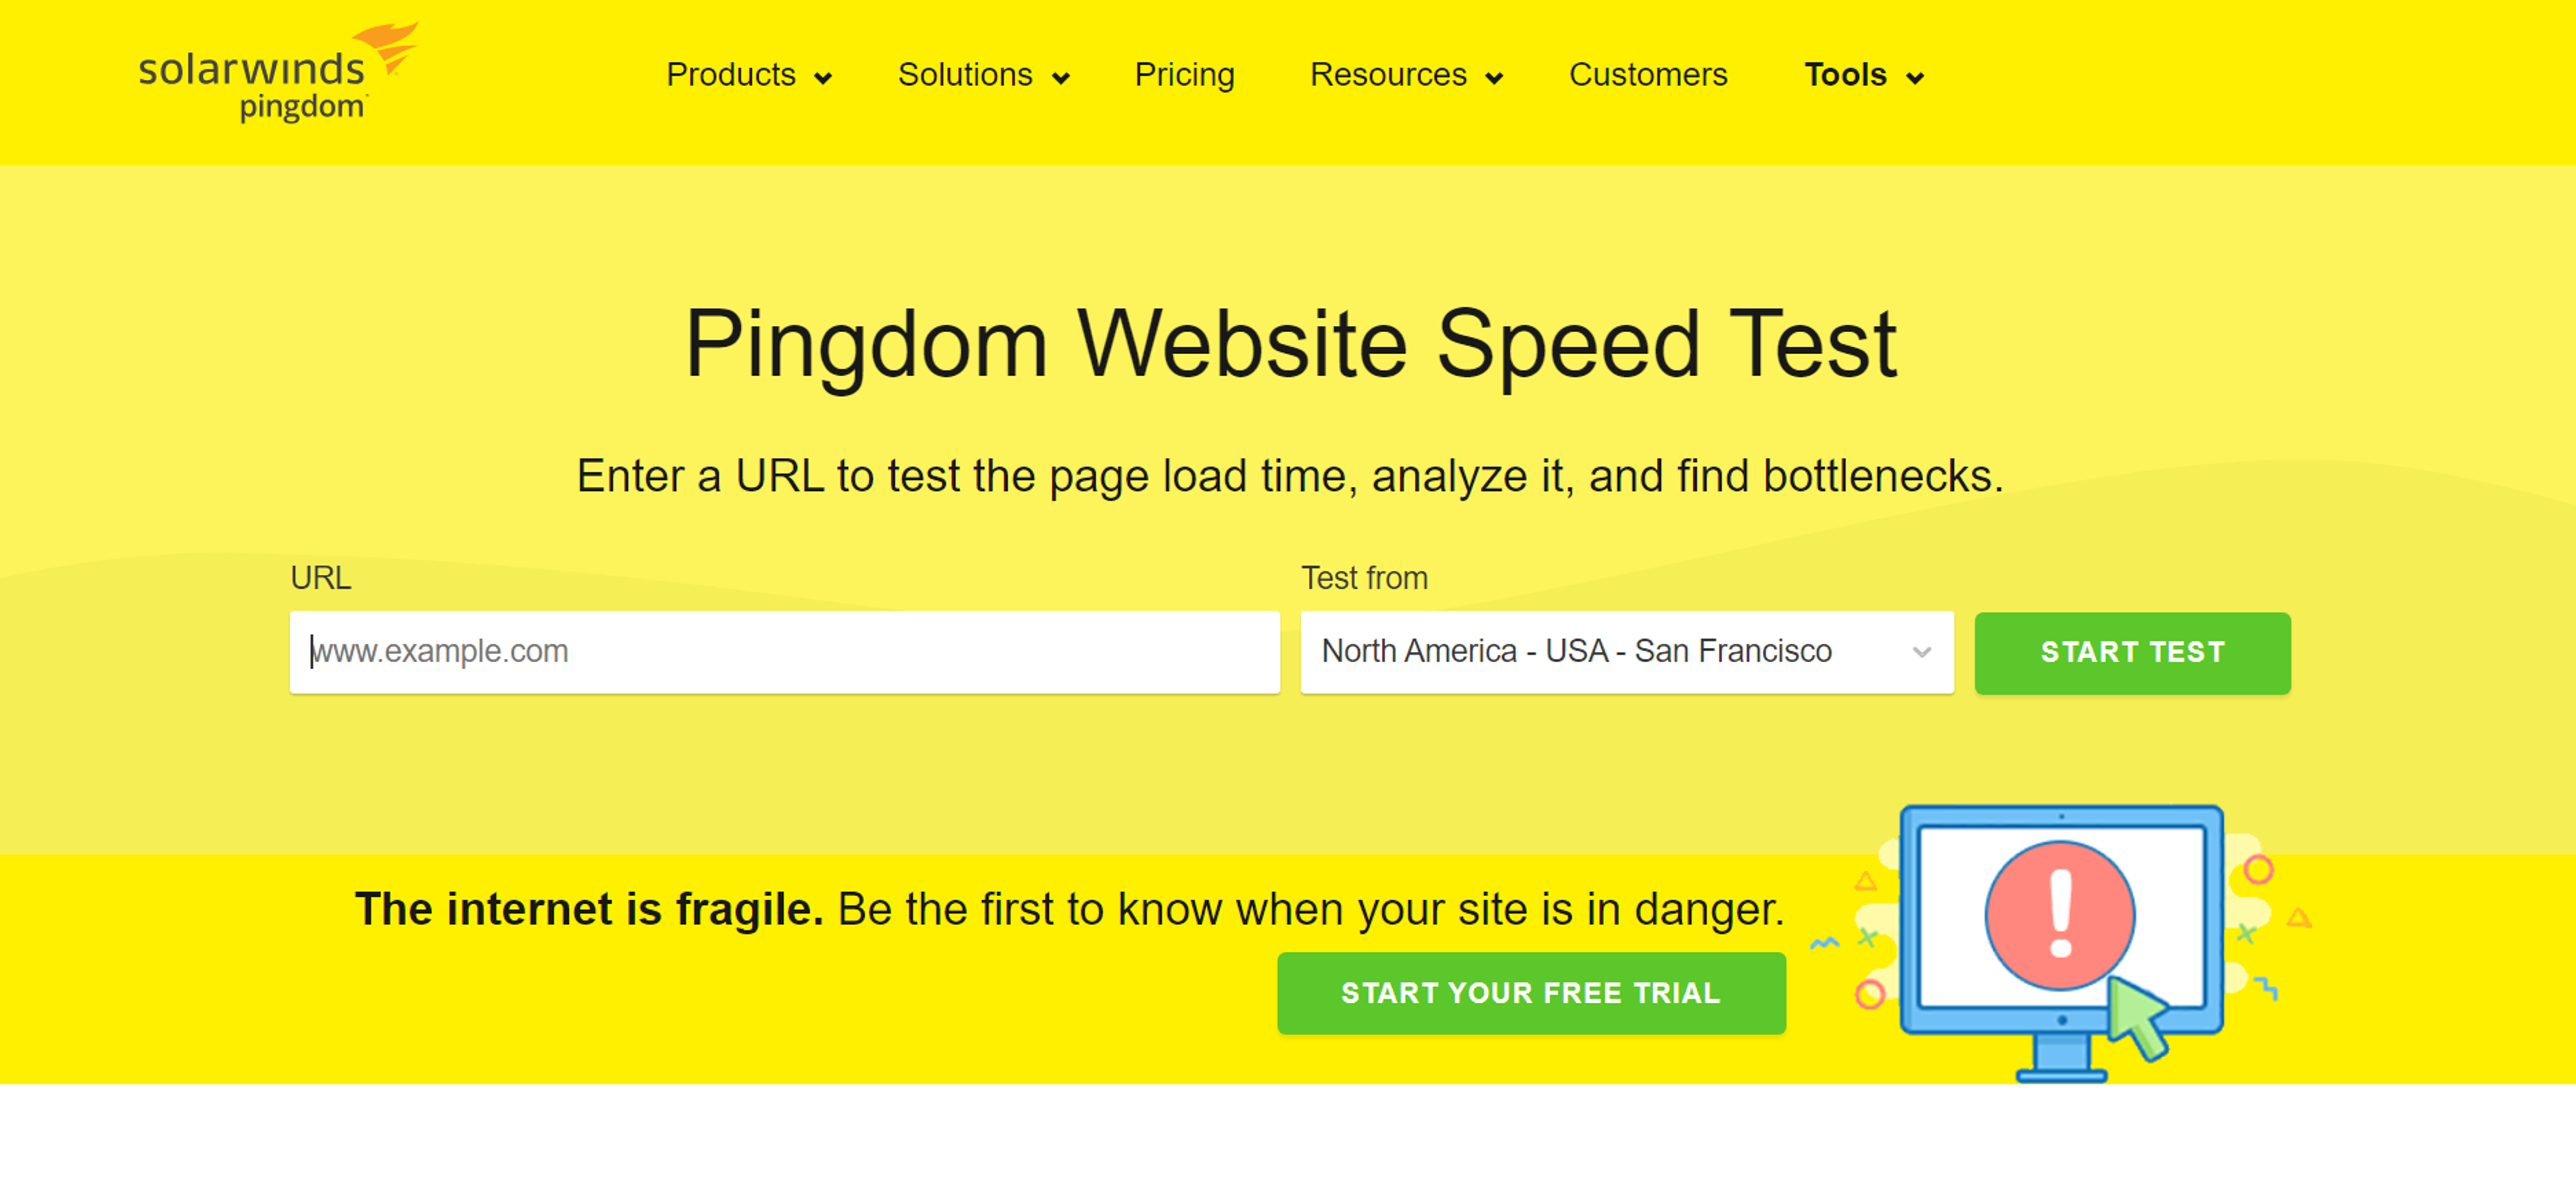
- Pingdom Tools: Offers website performance testing, including load time analysis and suggestions for improvement. These tools allow users to conduct a speed test enter by inputting a URL to analyze page load time and identify performance bottlenecks.
Source: tools.pingdom.com
Server-Side Tools
- New Relic: Provides performance monitoring for backend services and gives insights into how server-side processes are impacting front-end performance.
- Dynatrace: Offers comprehensive monitoring for applications, servers, and databases, ensuring efficient backend operations that complement front-end speed.
- Apache JMeter: A powerful open-source tool designed to test performance and load for server-side setups and APIs.
Combining these tools with proper analysis can help ensure optimal website performance, enabling developers to address potential bottlenecks and deliver seamless user experiences.
How to Measure Site Speed the Right Way
Select Metrics: We will focus on the key metrics of first contentful paint, largest contentful paint, time to interact, and cumulative layout shift.
Test Hypothesis: Always set up simulations to load a site using various phones, on different networks, and from other locations for performance analysis.
Analyze Results: Analyze the metrics based on the baseline and established performance budgets to identify target areas for improvement.
Implement Changes: If you identify areas of concern, you must address them. Some options available are optimizing assets, reducing server response time, and employing Lazy loading.
Re-test and Validate: Always perform the tests again to ensure the modifications do not create new issues.
Each of these steps requires more consideration. However, their purpose is to allow you to diagnose and remedy issues easily. With these steps, you can be sure that the sites will be in good shape and perform well in the years to come.
Website Speed: Monitoring the Results
With the majority of internet users accessing websites through mobile devices, mobile optimization is crucial for faster load times.
A slow mobile website can lead to high bounce rates and a poor user experience, resulting in lost conversions and revenue.
To optimize your website for mobile devices, ensure that your website is responsive and adapts to different screen sizes and devices.
Use mobile-friendly templates and themes, and optimize images and content for mobile devices.
Additionally, use mobile-specific optimization techniques such as lazy loading, caching, and minification to reduce page load times.
By optimizing your website for mobile devices, you can improve user experience, increase conversions, and boost search engine rankings.
Improving Performance Based on Analysis
After reviewing your test data, it might be time to implement the enhancements. Start with the most impactful issues: server response time, asset size (images/video), latency, and cache time (multiple load times).
One potent trick is to optimize the loading sequence of specific resources. By deferring and loading parts of the page asynchronously, the time it takes to show the relevant page can be reduced, resulting in a much better user experience.
Make sure to work on the server side as well. Optimize database queries and remove unnecessary code execution, which causes latency.
Lastly, set intervals to measure performance, improvement, and any additional issues that may arise. This will make websites more reliable, faster, and more engaging.
Monitoring and Maintenance
Regular Maintenance
Regular maintenance is essential for sustaining optimal website performance over time. This includes updating software dependencies, optimizing databases, and refining code to remove inefficiencies that could hinder performance.
Routine reviews of caching strategies, CDN configurations, and Service Worker functionality ensure the system evolves with changing user needs and technological advancements.
Website Speed Test Comparison
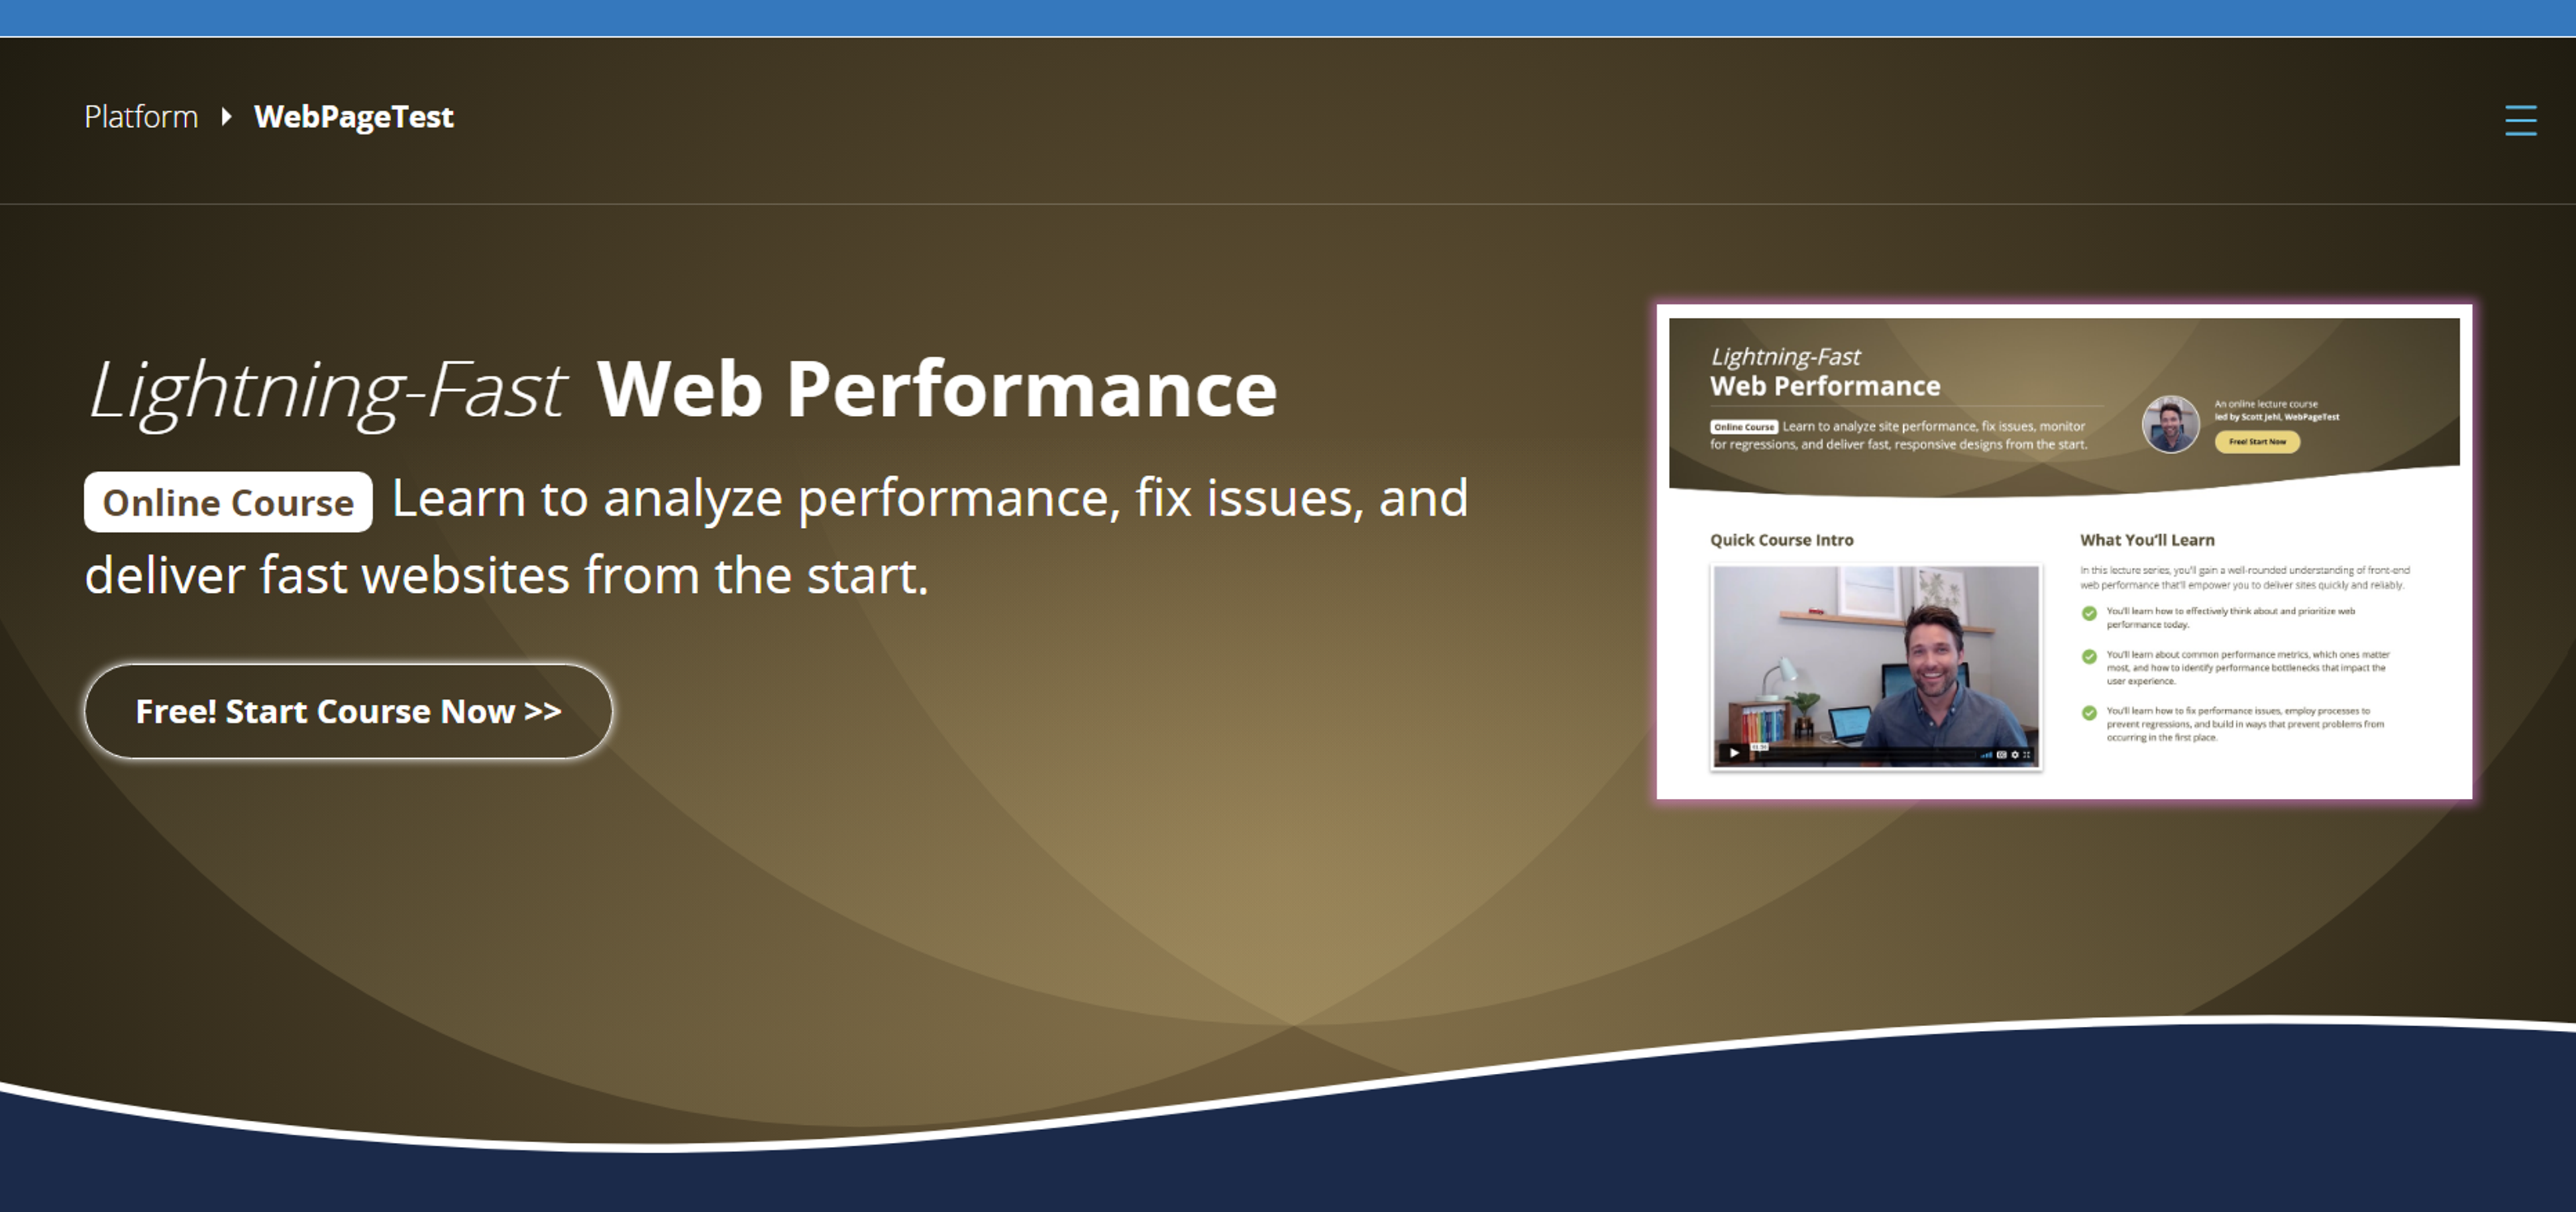
Frequent performance audits detect problem areas or obsolete practices that could be detrimental to the user experience. Tools such as Google Lighthouse and WebPageTest aid teams in providing in-depth performance analysis.
Source: webpagetest
These audits should also cover metrics such as resource interactivity, delivery efficiency, and responsiveness across different devices and network types to ensure performance efficiency.
Scalability Readiness
Every growth comes with the requirement of scalability. Constantly assessing the servers’ capabilities, the traffic volume patterns, as well as the resources ensures that the infrastructure can handle surges in the users’ activities.
This involves maintaining redundancy through the implementation of load balancing and the management of the database in anticipation of high usage. Also, being ready for expansion in advance avoids hiccups and enhances navigation within the system.
Through effective monitoring and preventive maintenance tasks, sites can improve performance and actively adjust to changing web trends.
Content-Heavy Websites
Web content, such as documents or text pages constituting a single website, poses challenges at the server level due to the amount of content being stored and provided to users. An aspect of utmost significance is the construction of efficient data caching systems, which are increasingly needed to optimize resources and improve load times.
In addition, applications that offer the ability to load media lazily optimize their perception by restricting the amount of content downloaded at the onset. Files being sent can also be tested against Gzip or Brotli compression to improve the speed of delivery appreciably.
As a supplementary measure, keeping track of the sucked up restricted queries and readjusting them may ease the bottleneck when retrieving or updating content. A content delivery network (CDN) that physically spreads out a content set can guarantee high performance when the networked users are dispersed globally.
An example of a website that has such a heavy amount of content is the following:
Source: awardonline.com

FAQ
What Exactly Is “Website Speed”?
It’s how quickly key parts of a page load, respond, and stay stable. Modern speed is judged by Core Web Vitals: LCP (loading), INP (interactivity), and CLS (visual stability).
What’s The Difference Between Lab And Field Data?
Lab runs in a controlled environment to debug issues. Field reflects real users and is what Google uses to assess Core Web Vitals. You need both.
What Tanks INP and How Do I Improve It?
Heavy main-thread work, long tasks, slow event handlers, and third-party scripts. Ship less JS, split/defer non-critical work, break up long tasks, and offload to Web Workers when possible.
Why Does CLS Happen and How Do I Prevent It?
Unexpected shifts come from media without set sizes, late ads/embeds, and font swaps. Reserve space, pre-size containers, and use robust font-loading.
Read more:
Conclusion
When it comes to single-page applications (SPAs), speed and smoothness are everything. Users expect instant responses and fluid interactions — no hiccups, no delays. That’s why optimizing SPAs is essential to delivering a truly seamless experience.
Developers can keep things fast, responsive, and scalable by using smart strategies like minimizing bundle sizes, splitting code by routes to avoid loading everything at once, and managing app state efficiently. These tweaks might seem small, but together they make a huge difference — keeping your app light, quick, and a joy to use.

About Clay
Clay is a UI/UX design & branding agency in San Francisco. We team up with startups and leading brands to create transformative digital experience. Clients: Facebook, Slack, Google, Amazon, Credit Karma, Zenefits, etc.
Learn moreAbout Clay
Clay is a UI/UX design & branding agency in San Francisco. We team up with startups and leading brands to create transformative digital experience. Clients: Facebook, Slack, Google, Amazon, Credit Karma, Zenefits, etc.
Learn more